Viewing the SAP Alerts
The eG monitoring console provides a dedicated interface for selectively viewing the history of alerts related to managed SAP ABAP components. With the help of this interface, administrators can at-a-glance infer the number, nature, status, and severity of issues encountered by the SAP ABAP environment, currently and in the past. This information will enable administrators to understand how problem-prone their SAP environment has been over time, study problem patterns, isolate recurring problems (if any), and arrive at effective solutions.
Moreover, active alerts awaiting manual completion can be effortlessly identified using this interface, and such alerts can also be closed by employing a simple sequence of mouse-clicks on this interface.
To access this interface, follow the menu sequence, Components -> SAP -> Alerts in the eG monitoring console. Figure 1 will then appear.
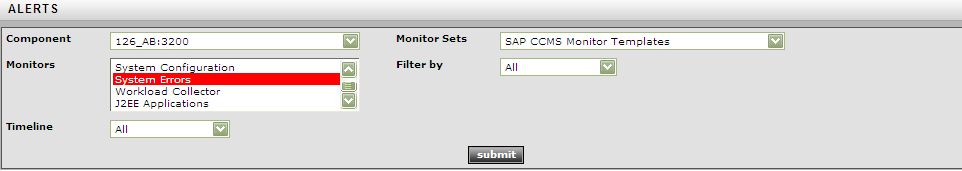
Figure 1 : The SAP Alerts page with the filter criteria
In this page, do the following:
- To view the SAP alerts related to a particular SAP ABAP component, select a Component.
- Once a Component is selected, the Monitor Sets list will be populated with the monitor sets that currently exist for the selected component. To view the alerts for specific monitor sets, pick them from the Monitor Sets list.
- The monitors that are available within the chosen monitor sets will be populated automatically in the Monitors list. Select the monitors of your choice from this list.
-
Use the Filter By list to filter your alerts based on their current status. The options available here are as follows:
- Active: Pick this criterion to view the currently active alerts pertaining to the selected monitor sets and the monitors.
- Done: This criterion is selected to view the list of alerts that were completed by the administrator.
- Auto Completed: You can select this option to view the list of alerts that were completed automatically by the SAP system.
- All: Select this option to view all alerts related to the chosen monitors, regardless of their status.
-
Then, from the Timeline list box, select the time period for which you wish to view the alerts. The timeline options available are as follows:
- To view all the alerts that were generated by the SAP ABAP system since startup, select the All option from the Timeline list box.
- If you wish to view the alerts that were prevalent for a short period during the last 24 hours, pick the Last X Minutes option. This will invoke the Hr and Min list boxes using which you can specify a particular time period for which you wish to view the alerts.
- By picking the Any option, you will be allowed to select the date/time range from the list boxes that appear next to the Timeline option.
Note:
The date/time range provided as part of the Any Timeline specification will pertain to the time zone of the sap user configured for the New alerts in the last measurement period test.
- Finally, click the Submit button to view the list of alerts that fulfill the selected criteria.
-
If the Filter by option was set to All, then all alerts related to chosen monitor sets and monitors will appear, regardless of status (see Figure 2).
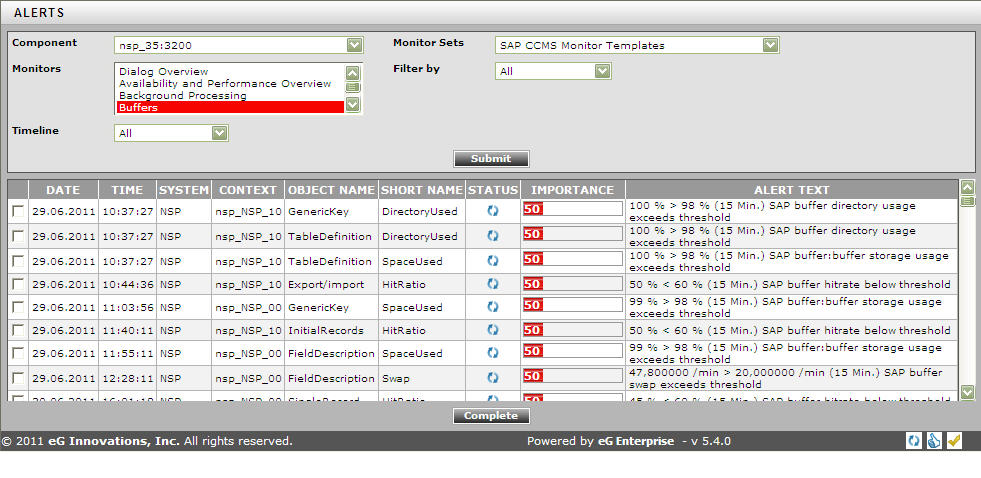
Figure 2 : The SAP Alerts page displaying all alerts, regardless of status
-
On the other hand, if you had chosen the Active alerts from the Filter by list, then only the currently active alerts will appear.
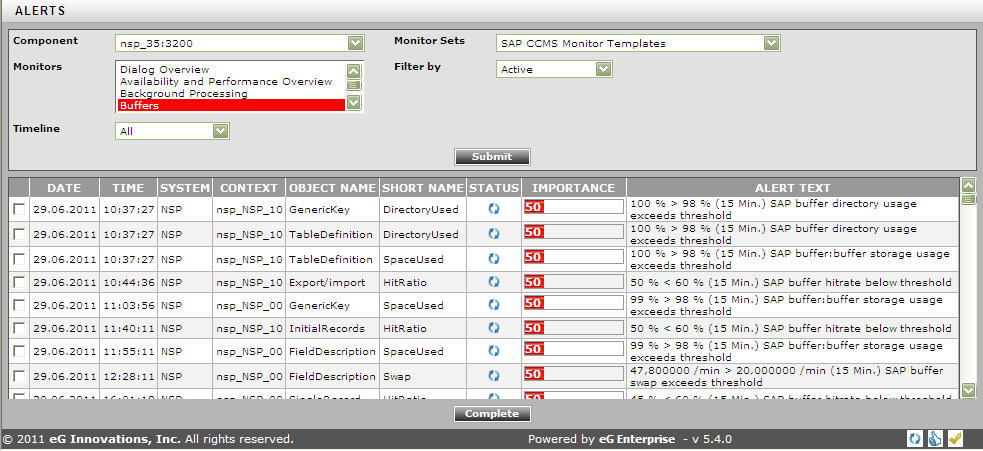
Figure 3 : The SAP Alerts page displaying only the active alerts
-
Regardless of the Filter by option chosen, the details displayed for each alert include the Date, Time, System (the name of the SAP ABAP system), Context (the instance on which this alert has occurred), Object Name and Short Name (the name of the monitoring object and its corresponding attribute that is responsible for this alert). Also, in the Status column, the status of each alert will be indicated using symbols. In other words, the
 symbol will be displayed to represent an Active alert. Likewise, the
  symbol represents the alerts that were Auto Completed by the SAP ABAP system and the
  symbol represents that the alerts were completed i.e., Done by the administrator. Besides status, an alert is also accompanied by ‘importance’ indicators. The importance of an alert is represented by a color coding and a severity value ranging from 0 to 255, encrypted on the color. A red color in the Importance column indicates that the alert is critical and a yellow color in the Importance column indicates that this is a warning alert. An elaborate description of alert will be available in the Alert text column. The alerts displayed in this page are sorted in the order and sequence specified below:
 - ascending order of the monitors chosen from the Monitors list box in Figure 3
- ascending order of status code (active/done/auto-completed),
- descending order of severity values (most severe alerts appear first)
- ascending order of alert time stamps
- ascending order of the ID of the alert (note that the alarm ID will not be displayed in the Figure 3, and is maintained internally by the eG Enterprise system; this will be however used for the sorting purposes).
Note:
The date and time displayed for every alert in this page will pertain to the time zone of the sap user configured for the New alerts in the last measure period test.
- Active alerts can also be completed on-the-fly, using this page. For this purpose, simply select the check box corresponding to an active alert, and click the Complete button below (see Figure 3)