Monitoring SAP Business Objects
eG Enterprise provides a specialized, web-based SAP BOBI monitoring model for continuously monitoring the SAP Business Objects.
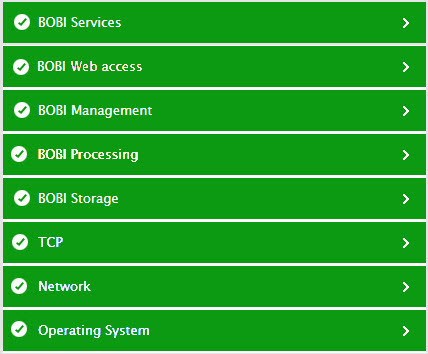
Figure 7 : The layer model of the SAP BOBI platform
Each layer of the layer model above is mapped to tests that monitor the overall health, availability, and performance of each of the servers running in a configured node. Using the metrics so reported, administrators can find quick and accurate answers for the following performance queries:
- Are the various BOBI services in healthy state? Is the node healthy ?
- What is the system load in terms of publications, instances running, reports scheduled etc.,?
- What are the errors occurring in the various Crystal Reports servers defined?
- What is the load generated by the Multi Dimensional Analysis service in terms of queries running, sessions and cubes created?
- How many resource intensive queries are running for the Data Federation service? What is the disk and memory utilization of queries run by this service? How many queries have failed? What is the current number of connections created?
- Are there any Dashboards server errors?
- How is the Platform Search Service performing?
- Are there any errors from connection servers, web intelligence servers etc.,?
- Is the BI launchpad available? What is the response time like?
- Is the Central Management Server auditing properly? How many users are currently using the server? What is their average response time?
- Have any Central management server jobs failed? How many jobs are pending?
- Are the Job Server destinations available? Are there are errors in the server?
- What is the performance of the Adaptive Processing Server JVM? Are there any errors in this server?
- What is the utilization and response time of the Dashboards processing server?
- How many connections are used by the Data Semantic Layer Bridge? How many queries are being run for this service?
- How many documents is the Report Application Server processing? What is its thread utilization?
- How many CORBA requests is the web intelligence server processing? How many users are using the web intelligence server? Are too many sessions getting timed-out?
- How is the web intelligence server cache utilization? What is the cache swap rate?
- Is the web intelligence server using too much memory ? What is its CPU utilization ?
- How is the Dashboards cache server performing? Is it slow?
- How many files are accessed through the file repository server? How many connections? What are the data transfer rates?
- How is the health of each configured server? Which servers are enabled and are they running properly?
- What is the rate of error messages occurring in the various servers running in this node? What are those error messages?
- Is the root directory of the file repository server's partition running out of free space?
- Are the BOBI server processes running? How much CPU and memory are they using the node's computer?
- What is the performance of the host computer on which the node has been installed? How is its connectivity?
The bottom 3 layers are similar to that of the Windows Generic Server model. For more information about these layers, see Unix and Windows Servers.