Monitoring SAP HANA Database Server
The eG Enterprise provides a dedicated SAP HANA monitoring model, which is capable of monitoring the core components of the SAP HANA architecture – from its memory structures, to its transactions and services – and promptly reporting failures to administrators to enable a speedy resolution.
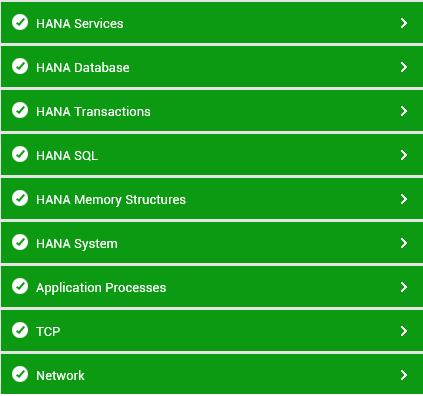
Figure 6 : The layer model of the SAP HANA database server
Every layer of the layer model is mapped to a wide variety of tests that run periodic health checks on all performance-influencing parameters of the SAP HANA database server and extract a plethora of performance metrics.
For these tests to run, the pre-requisites detailed in How to Monitor SAP HANA Database Server Using eG Enterprise? will have to be in place.
The metrics thus collected would be useful to figure out accurate answers to the following performance queries:
- Is the SAP HANA database server available? How long has the SAP HANA database server been up?
- How quickly does the SAP HANA database server respond to user requests?
- How many connections to the SAP HANA database server are currently active or running? Are any connections idle?
- Are the critical services of the SAP HANA database server currently active? If so, for how long has each service been up?
- How quickly were requests serviced by each service of the SAP HANA database server? Does any service process requests slowly? How many requests are currently pending for processing with that service?
- How many threads are currently active for each service?
- How much CPU and memory does each service use? Is any service utilizing these resources excessively?
- Is enough physical memory available for use with each service?
- Is the server overloaded with query execution requests? If so, which service on the server is handling the maximum executions?
- Is any service performing too many rollbacks? If so, which one is it?
- Are any transactions blocked?
- Is any expensive SQL statement executing on the SAP HANA database server? If so, what is the maximum duration of its execution?
- Is the server utilizing its cache well? Or should the cache be resized to ensure its effective usage?
- Is any disk volume on the server running out of space? If so, which one is it – data, log, or trace?
- Are the disk volumes used by the services adequately sized? Or is any service using its disk volumes excessively? If so, which service is it and which disk volume is being over-utilized – data or log?
- Is the server hogging the CPU? If so, where is maximum CPU time being spent – in system-level processing? in handling user requests? In waiting for I/O? or in just being idle?
- Does the server have sufficient physical memory to discharge its duties?