Monitoring the SAP Hybris
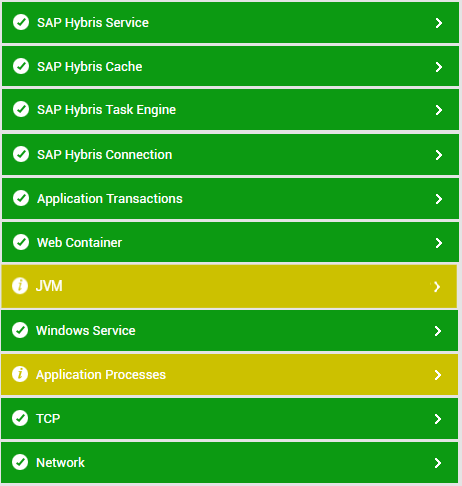
The eG Enterprise embeds a specialized monitoring model for the SAP Hybris (see Figure 1), using which the performance of the critical services and components of the system can be tracked, issues affecting system performance captured at the earliest, and the root-cause of the issues promptly traced and treated before it adversely impacts the business in the overall SAP environment.

Figure 1 : The layer model of the SAP Hybris Component
Every layer depicted by Figure 1 is associated with a series of tests, each of which seeks to answer the following questions related to the performance of the SAP Hybris system:
- If the scheduled cron jobs are running properly and efficiently?
- What is the current number of jobs running across the system?
- How well the Entity Region Cache is performing?
- What is the number of entries in Region Cache, fill ratio and hit rate?
- What percentage of Flexible Query Cache is used?
- If Task Engine database is setup properly and number of table condition and tasks are within limits?
- What is the number of table conditions and table tasks configured?
- How much time the task engine is taking in executing each task and execution hit rate is within limit?
- What is the size of pooling queue and time spent by each task in the queue.
Since the Windows Service, Application Transaction and Application processes layers of Figure 1 have already been discussed in detail in the Unix and Windows Servers document, let us now focus on the remaining layers in the forthcoming sections.