Monitoring SAP Java System
eG Enterprise provides a specialized monitoring model for SAP Java System.
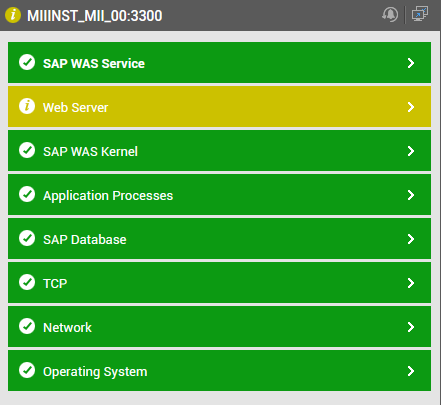
Figure 1 : Layer model of the SAP Java System
Each layer of Figure 1 is mapped to tests that monitor the messages sent by each cluster element, the count of access points, health and status of each process, the status of the Enqueue Replication Server and report anomalies (if any). Using the metrics reported by these tests, administrators can find quick and accurate answers for these performance queries:
- How many messages were sent by each cluster element?
- Which cluster element had transferred the maximum amount of data?
- What is the rate at which broadcast messages were sent by each cluster element to another?
- What is the rate at which broadcast requests were sent by each cluster element to another?
- How many P2P messages were sent by each cluster element per minute? Which cluster element had sent the maximum number of P2P messages per minute?
- Is the Enqueue Replication Server enabled? If enabled, is the Enqueue Replication Server active?
- What is the health of each process?
- Which are the processes that are currently not running?
- Which processes were restarted recently?