Monitoring the SAP Web Application Server
The eG Enterprise embeds a specialized monitoring model for the SAP Web AS (see Figure 3), using which the performance of the critical services and components of the server can be tracked, issues affecting server-performance captured at their infancy, and the root-cause of the issues promptly traced and treated before it adversely impacts the transaction of business in the SAP environment.
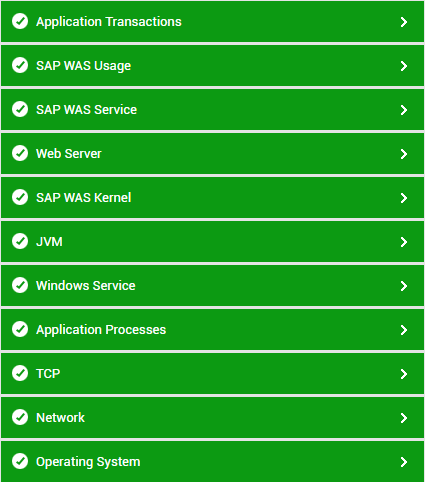
Figure 3 : The layer model of the SAP Web AS
Every layer depicted by Figure 3 is associated with a series of tests, each of which seeks to answer the following questions related to the performance of the SAP Web AS:
- Are the thread managers of the SAP Web AS making optimum use of the threads in the pool?
- Are direct database accesses kept at a minimum?
- What type of connection requests are received by the SAP Web AS? How well does the server handle these requests?
- How is the memory usage of the Java objects managed by the SAP Web AS?
- Is the server cache been utilized effectively?
- Were any HTTP connections terminated abnormally by the SAP Web AS?
- Has the SAP Web AS been sized adequately to handle both the present and future logs?
- Has sufficient memory been allocated to the JVM?
- Have any new bean instances been added/removed from a bean pool? What are they?
- Are there any invalid user sessions on the SAP Web AS?
- How often do transaction rollbacks occur on the SAP Web AS?
- Are too many transactions/sessions getting timed out?
- Is the P4 connection to the server available? How quickly was the connection established?
- Is the web server component on the SAP Web AS accessible? What is its response time?