Monitoring the SAP Web Dispatcher
eG Enterprise offers a specialized SAP Web Dispatcher monitoring model that monitors the current state of the SAP Web Dispatcher, the errors logged in trace log, security log etc, the current state and requests processed by each thread, the current state of each destination etc - and proactively alerts administrators to potential performance bottlenecks, so that administrators can resolve the issues well before end-users complain.
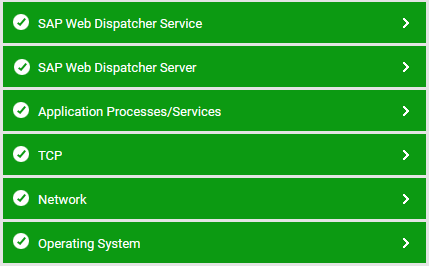
Figure 4 : The layer model of SAP Web Dispatcher
Each layer of the layer model above is mapped to a variety of tests, each of which report a host of useful metrics pertaining to the SAP Web Dispatcher. Using these metrics, administrators can find quick and accurate answers to the following queries:
- What is the current state of the SAP Web Dispatcher?
- How many connections of each type are made to the SAP Web Dispatcher and how long did it take to establish a connection?
- How many requests were processed by each thread?
- What is the current state of each thread?
- What is the current operational state of the SAP Web Dispatcher?
- How many threads are created for processing the requests?
- How many connections are currently open?
- How many requests were awaiting the threads for processing?
- How many errors were encountered in the trace log, security log and http access log?
- Is the destination currently available?
- What is the current operational state of each destination?
- What is the capacity and load on each destination?
- How many stateful and stateless requests were processed on each destination?
- How long did it take for a request to reach the destination?
- How many HTTP and HTTPS connections were made to each destination?
- How many entries were stored in the SAP Web Dispatcher cache? Among them how many entries were invalid?
- What is the size of all the entries in the cache?
- Are the cache instances adequately sized?
- Are there any cache instances that service minimal requests?
- Are there too many errors noticed on the SAP Web Dispatcher?
- Is the data read and written to and from the SAP Web Dispatcher consistent?
- Is there a sudden spike in the count of active connections handled by any host?