SCVMM Hosts Test
Virtual machine hosts are physical computers that are managed by VMM on which you can deploy virtual machines.
SCVMM allows automatically profiling hosts in the environment and placing VMs on the host that has the best fit for hosting those resources. If required, administrators can modify this built-placement algorithm or even define new placement rules, which will dictate where VMs are to be deployed. For this purpose, administrators need to track the state of the individual hosts in each cluster managed by VMM, and also study the resource consumption of every host. Where VMM manages numerous clusters, it can be near-impossible for administrators to manually perform the status and usage tracking per host. This is where the SCVMM Hosts test helps!
This test automatically discovers the clusters and hosts managed by VMM. For each host in every cluster, the test then reports the current status of the host. In the process, the test reveals the hosts that are available for placement and the hosts that are not. Additionally, the test reveals how well each host is utilizing the CPU, memory, disk, and network resources available to it. This enables administrators to accurately identify hosts that are running out of resources. By reporting how many VMs exist per host and in which states (powered-on, powered-off, others), the test helps administrators figure out which hosts can accommodate more VMs and which cannot. These insights help administrators to determine which placement model to adopt - the resource maximization model or the load balancing model. While the resource maximization model aims to make maximum use of the resources available on a host by deploying the maximum number of VMs on it, the load balancing model locates VMs in an effort to balance resource usage across all hosts.
Moreover, the detailed diagnostics reported by the test also point administrators to the resource-hungry VMs on the hosts.
Target of the test : SCVMM
Agent deploying the test : An internal agent
Outputs of the test : One set of the results for each host in each cluster managed by SCVMM
First level descriptor: Cluster
Second level descriptor: Host
| Parameter | Description |
|---|---|
|
Test Period |
How often should the test be executed. |
|
Host |
The IP address of the SCVMM server being monitored |
|
Port |
The port at which SCVMM listens. The default is 'null'. |
|
Domain, Username, Password, and Confirm Password |
The eG agent runs PowerShell scripts on SCVMM to pull metrics. To run these scripts, the eG agent requires the permission of an SCVMM administrator with 'read-only' privileges. In order to grant this permission to the eG agent, configure the Username and Password parameters of this test with the credentials of an SCVMM administrator with 'read-only' privileges. Confirm the password by retyping it in the Confirm Password text box. Then, specify the domain to which this user belongs against the Domain text box. |
|
DD Frequency |
Refers to the frequency with which detailed diagnosis measures are to be generated for this test. The default is 1:1. This indicates that, by default, detailed measures will be generated every time this test runs, and also every time the test detects a problem. You can modify this frequency, if you so desire. Also, if you intend to disable the detailed diagnosis capability for this test, you can do so by specifying none against DD frequency. |
|
Detailed Diagnosis |
To make diagnosis more efficient and accurate, the eG Enterprise embeds an optional detailed diagnostic capability. With this capability, the eG agents can be configured to run detailed, more elaborate tests as and when specific problems are detected. To enable the detailed diagnosis capability of this test for a particular server, choose the On option. To disable the capability, click on the Off option. The option to selectively enable/disable the detailed diagnosis capability will be available only if the following conditions are fulfilled:
|
| Measurement | Description | Measurement Unit | Interpretation | ||||||||||||||||||||||||||
|---|---|---|---|---|---|---|---|---|---|---|---|---|---|---|---|---|---|---|---|---|---|---|---|---|---|---|---|---|---|
|
Is remote FX installed? |
Indicates whether/not remoteFX is installed on this host. |
Number |
RemoteFX is an umbrella term for several technologies designed to enhance the Remote Desktop/VMConnect experience for VMs. The values that this measure reports and their corresponding numeric values are listed in the table below:
Note: By default, this measure reports the Measure Values listed in the table above to indicate whether /not RemoteFX is installed on a host. In the graph of this measure however, the same is indicated using the numeric equivalents only. Using the detailed diagnosis of this measure, you can identify the host group and cluster to which a host belongs, and determine the domain name and operating system of that host. |
||||||||||||||||||||||||||
|
Is CPU SLAT? |
Indicates if CPU SLAT is enabled on this host or not. |
Number |
Modern processors use the concepts of physical memory and virtual memory; running processes use virtual addresses and when an instruction requests access to memory, the processor translates the virtual address to a physical address using a page table or translation lookaside buffer (TLB). When running a virtual system, it has allocated virtual memory of the host system that serves as a physical memory for the guest system, and the same process of address translation goes on also within the guest system. This increases the cost of memory access since the address translation needs to be performed twice – once inside the guest system (using software-emulated shadow page table), and once inside the host system (using hardware page table). In order to make this translation more efficient, processor vendors implemented technologies commonly called SLAT. By treating each guest-physical address as a host-virtual address, a slight extension of the hardware used to walk a non-virtualized page table (now the guest page table) can walk the host page table. With multilevel page tables the host page table can be viewed conceptually as nested within the guest page table. A hardware page table walker can treat the additional translation layer almost like adding levels to the page table. Using SLAT and multilevel page tables, the number of levels needed to be walked to find the translation doubles when the guest-physical address is the same size as the guest-virtual address and the same size pages are used. This increases the importance of caching values from intermediate levels of the host and guest page tables. It is also helpful to use large pages in the host page tables to reduce the number of levels (e.g., in x86-64, using 2 MB pages removes one level in the page table). Since memory is typically allocated to virtual machines at coarse granularity, using large pages for guest-physical translation is an obvious optimization, reducing the depth of look-ups and the memory required for host page tables. The values that this measure reports and their corresponding numeric values are listed in the table below:
Note: By default, this measure reports the Measure Values listed in the table above to indicate whether /not CPU SLAT is enabled on a host. In the graph of this measure however, the same is indicated using the numeric equivalents only. |
||||||||||||||||||||||||||
|
Is NUMA spanning expanded? |
Indicates the number of VMs in this cluster. |
Number |
NUMA stands for non-uniform memory architecture. In simplistic terms, NUMA allows for greater levels of scalability than traditional hardware expansion options, such as SMP. NUMA accomplishes this goal by eliminating what is a single choke point in traditional computing architecture: the memory bus. By adding more memory buses, a system can be scaled to greater heights. Each node in a NUMA architecture is generally considered a block of memory and the processors and I/O devices that are on the same physical bus as the aforementioned memory. Individual nodes are then aggregated through the use of an interconnect bus. The values that this measure reports and their corresponding numeric values are listed in the table below:
Note: By default, this measure reports the Measure Values listed in the table above to indicate whether/not NUMA spanning is enabled on a host. In the graph of this measure however, the same is indicated using the numeric equivalents only. |
||||||||||||||||||||||||||
|
Is host in maintenance mode? |
Indicates whether/not this host is in the maintenance mode. |
|
If a Host is set in Maintenance mode in SCVMM, then such a host "Saves" all the VMs in it. In case of a two-node cluster, if you set maintenance mode for one node of the cluster, then it pauses the cluster role and it gives you an option if you want to save the VMs or live migrate them to the other node. If you set the Maintenance mode for all nodes in a cluster, then it will save all the VMs as there is no place to Live Migrate them. The values that this measure reports and their corresponding numeric values are listed in the table below:
Note: By default, this measure reports the Measure Values listed in the table above to indicate whether/not a host is in the maintenance mode. In the graph of this measure however, the same is indicated using the numeric equivalents only. |
||||||||||||||||||||||||||
|
Is host available for placement? |
Indicates whether/not this host is available for the placement of VMs. |
Number |
The values that this measure reports and their corresponding numeric values are listed in the table below:
Note: By default, this measure reports the Measure Values listed in the table above to indicate whether/not a host is available for placement. In the graph of this measure however, the same is indicated using the numeric equivalents only. |
||||||||||||||||||||||||||
|
Overall state |
Indicates the overall status of this host. |
|
The values that this measure reports and their corresponding numeric values are listed in the table below:
Note: By default, this measure reports the Measure Values listed in the table above to indicate the current state of a host. In the graph of this measure however, the same is indicated using the numeric equivalents only. Using the detailed diagnosis of this measure, you can identify the host group and cluster to which a host belongs, and determine the domain name and operating system of that host. |
||||||||||||||||||||||||||
|
Communication state |
Indicates the whether/not this host is currently responding to network requests. |
|
The values that this measure reports and their corresponding numeric values are listed in the table below:
Note: By default, this measure reports the Measure Values listed in the table above to indicate the current communication state of a host. In the graph of this measure however, the same is indicated using the numeric equivalents only. |
||||||||||||||||||||||||||
|
Physical CPUs |
Indicates the number of physical CPUs supporting this host. |
Number |
|
||||||||||||||||||||||||||
|
CPU cores |
Indicates the number of CPU cores of this host. |
Number |
|
||||||||||||||||||||||||||
|
Logical processors |
Indicates the number of logical processors this host is associated with. |
Number |
|
||||||||||||||||||||||||||
|
CPU average |
Indicates the percentage of CPU resources used by this host. |
Percent |
If the value of this measure is close to 100% for any host, it means that that host is rapidly running out of CPU resources. Such a host may not be able to accommodate any more VMs. In such a situation, use the detailed diagnosis of this measure to know which VMs on the host are the leading consuming of its CPU resources. You may want to find out which resource-intensive processes are running on such VMs, as they could be the ones causing the CPU contention. |
||||||||||||||||||||||||||
|
CPU reserve |
Indicates the percentage of CPU resources to be reserved for the use of the host. |
Percent |
This is used for placement decisions for new VMs. |
||||||||||||||||||||||||||
|
Total memory |
Indicates the memory capacity of this host. |
GB |
Use the detailed diagnosis of this measure to know how much memory has been assigned to each VM on the host, the demand for that memory, the percentage of memory free on that VM, and the disk space allocated to that VM. |
||||||||||||||||||||||||||
|
Available memory |
Indicates the amount of memory that is unused on this host. |
GB |
A high value is desired for this measure. A consistent decrease in the value of this measure, is a sign that memory resources are being eroded. |
||||||||||||||||||||||||||
|
Memory usage |
Indicates the percent usage of memory resources on the host. |
Percent |
f the value of this measure is close to 100% for any host, it means that that host is rapidly running out of memory resources. Owing to the memory constraint, such a host may not be able to accommodate any more VMs. You can use the detailed diagnosis of this measure to know which VM on the host is starved for memory resources. |
||||||||||||||||||||||||||
|
Reserved memory |
Indicates the amount of memory reserved for the use of the host. |
GB |
|
||||||||||||||||||||||||||
|
Maximum memory per VM |
Indicates the maximum amount of memory each VM on this host can use. |
GB |
|
||||||||||||||||||||||||||
|
Minimum memory per VM |
Indicates the minimum amount of memory each VM on this host should use. |
GB |
|
||||||||||||||||||||||||||
|
Suggested maximum memory per VM |
Indicates the suggested memory per VM. |
GB |
|
||||||||||||||||||||||||||
|
Total remote storage |
Indicates the total capacity of the remote storage of this host. |
GB |
|
||||||||||||||||||||||||||
|
Available remote storage |
Indicates how much remote storage is still unused by this host. |
GB |
A high value is desired for this measure. If the value of this measure drops consistently for a host, then it means that that host's remote storage space is being eroded. If the situation persists, then soon, the host will be left with very little remote storage space to work with. |
||||||||||||||||||||||||||
|
Used remote storage |
Indicates how much remote storage space is currently being used by this host. |
GB |
A low value is desired for this measure. If the value of this measure increases consistently for a host, then it means that that host is over-utilizing it's remote storage space. |
||||||||||||||||||||||||||
|
Remote storage usage |
Indicates what percentage of its total remote storage capacity this host is currently using. |
Percent |
If the value of this measure is 100% or close to it for any host, it is a clear indication that the host is running out of remote storage space. You can add to the remote storage capacity of those specific hosts to avert any potential remote storage space contention. |
||||||||||||||||||||||||||
|
Total local storage |
Indicates the total capacity of the local storage of this host. |
GB |
|
||||||||||||||||||||||||||
|
Available local storage |
Indicates how much local storage is still unused by this host. |
GB |
A high value is desired for this measure. If the value of this measure drops consistently for a host, then it means that that host's local storage space is being eroded. If the situation persists, then soon, the host will be left with very little local storage space to work with. |
||||||||||||||||||||||||||
|
Used local storage |
Indicates how much local storage space is currently being used by this host. |
GB |
A low value is desired for this measure. If the value of this measure increases consistently for a host, then it means that that host is over-utilizing it's local storage space. |
||||||||||||||||||||||||||
|
Local storage usage |
Indicates what percentage of its total local storage capacity this host is currently using. |
Percent |
If the value of this measure is 100% or close to it for any host, it is a clear indication that the host is running out of local storage space. You can add to the storage local capacity of those specific hosts to avert any potential local storage space contention. |
||||||||||||||||||||||||||
|
Total storage |
Indicates the total storage capacity of this host. |
GB |
|
||||||||||||||||||||||||||
|
Available storage |
Indicates how much storage is still unused by this host. |
GB |
A high value is desired for this measure. If the value of this measure drops consistently for a host, then it means that that host is running out of storage space. If the situation persists, then soon, the host will be left with very little storage space to work with. |
||||||||||||||||||||||||||
|
Used storage |
Indicates how much storage space is currently being used by this host. |
GB |
A low value is desired for this measure. If the value of this measure increases consistently for a host, then it means that that host is over-utilizing it's storage space. |
||||||||||||||||||||||||||
|
Storage usage |
Indicates what percentage of its total storage capacity this host is currently using. |
Percent |
If the value of this measure is 100% or close to it for any host, it is the sign of a potential storage space crunch on the host. You can add to the storage capacity of those specific hosts to avert any potential storage space contention. |
||||||||||||||||||||||||||
|
Disk space reserve |
Indicates the amount of disk space set aside for this host. |
GB |
This measure is used for placement decisions of new VMs. You can use the detailed diagnosis of this measure to know how much disk I/O is utilized by each VM on the host. This will point you to the exact VM that is excessively utilizing the disk I/O resources. |
||||||||||||||||||||||||||
|
Max disk IO reserve |
Indicates the maximum number of disk I/O operations per second set aside for this host. |
IOPS |
This measure is used for placement decisions of new VMs. |
||||||||||||||||||||||||||
|
Network reserve |
The network capacity set aside for this host as a percentage of the overall resource. |
Percent |
This measure is used for placement decisions of new VMs. You can use the detailed diagnosis of this measure to know how each VM on the host is utilizing the network resources. This way, you can quickly identify VMs that are hogging the network resources of the host. |
||||||||||||||||||||||||||
|
Max simultaneous live migrations |
Indicates the maximum number of simultaneous live migrations performed this host can perform. |
Number |
|
||||||||||||||||||||||||||
|
Max storage simultaneous live migrations |
Indicates the maximum number of simultaneous live storage migrations performed this host can perform. |
Number |
|
||||||||||||||||||||||||||
|
Is support live migration? |
Indicates whether/not this host supports the live migration feature. |
|
The values that this measure reports and their corresponding numeric values are listed in the table below:
Note: By default, this measure reports the Measure Values listed in the table above to indicate the whether/not the host supports the live migration feature. In the graph of this measure however, the same is indicated using the numeric equivalents only. |
||||||||||||||||||||||||||
|
Is live migration enabled? |
Indicates whether/not live migration is enabled for this host. |
|
The values that this measure reports and their corresponding numeric values are listed in the table below:
Note: By default, this measure reports the Measure Values listed in the table above to indicate the whether/not live migration is enabled for the host. In the graph of this measure however, the same is indicated using the numeric equivalents only. |
||||||||||||||||||||||||||
|
Is migration in subnet? |
Indicates whether/not any subnet can be used for migration by this host. |
|
The values that this measure reports and their corresponding numeric values are listed in the table below:
Note: By default, this measure reports the Measure Values listed in the table above to indicate the whether/not a subnet can be used for migration. In the graph of this measure however, the same is indicated using the numeric equivalents only. |
||||||||||||||||||||||||||
|
Total VMs |
Indicates the total number of VMs on this host. |
Number |
|
||||||||||||||||||||||||||
|
Powered on VMs |
Indicates the number of VMs on this host that are powered on currently. |
Number |
Use the detailed diagnosis of this measure to know which VMs on the host are powered on. |
||||||||||||||||||||||||||
|
Powered off VMs |
Indicates the number of VMs on this host that are powered off currently. |
Number |
Use the detailed diagnosis of this measure to know which VMs on the host are powered off. |
||||||||||||||||||||||||||
|
VMs in other state |
Indicates the number of VMs on this host that are in a state other than powered off/on. |
Number |
Use the detailed diagnosis of this measure to know which VMs on the host are neither in a powered off, nor in a powered on state. |
||||||||||||||||||||||||||
|
Orphaned VMs |
Indicates the number of orphaned VMs on this host. |
Number |
An "orphaned" virtual machine is one that exists in the vCenter Server database but is no longer present in ESX host inventory Virtual machines can become orphaned if a host failover is unsuccessful, or when the virtual machine is unregistered directly on the host. If this situation occurs, move the orphaned virtual machine to another host in the data center on which the virtual machine files are stored. |
||||||||||||||||||||||||||
|
Template VMs |
Indicates the number of template VMs on this host. |
Number |
A VM template is a master copy image of a virtual machine that includes VM disks, virtual devices, and settings. A VM template can be used many times over for the purposes of VM cloning. You cannot power on and edit the template once it has been created. |
Using the detailed diagnosis of the Is remote FX installed? and Overall state measures, you can identify the host group and cluster to which a host belongs, and determine the domain name and operating system of that host.

Figure 11 : The detailed diagnosis of the Is remote FX installed? and Overall state measures
Use the detailed diagnosis of the CPU average measure to know which VMs on the host are the leading consuming of its CPU resources.
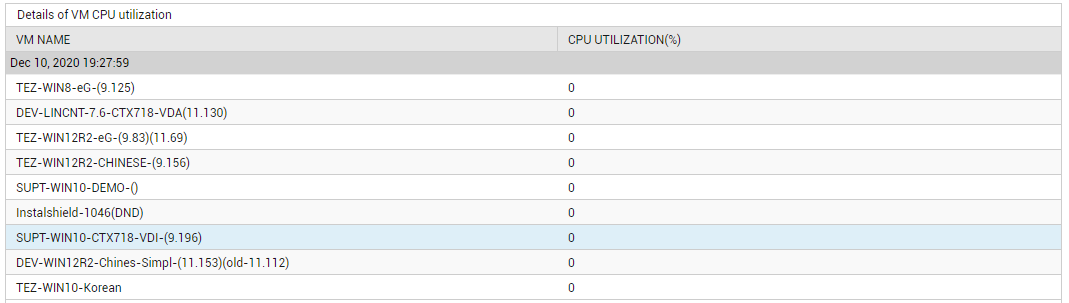
Figure 12 : The detailed diagnosis of the CPU average measure
You can use the detailed diagnosis of the Memory usage measure to know which VM on the host is starved for memory resources.
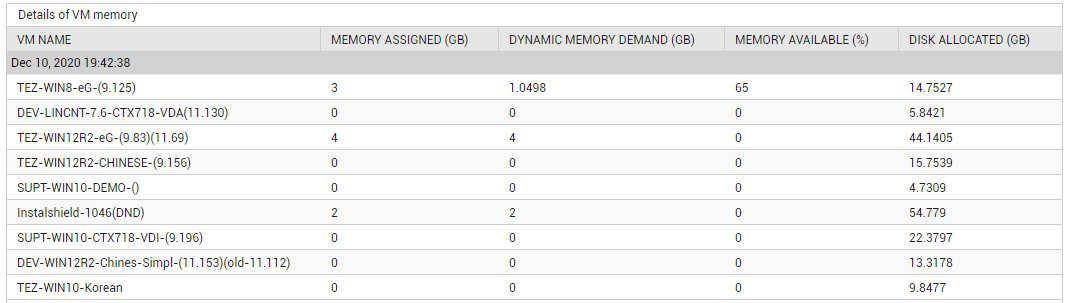
Figure 13 : The detailed diagnosis of the Memory usage measure
Use the detailed diagnosis of the Total memory measure to know how much memory has been assigned to each VM on the host, the demand for that memory, the percentage of memory free on that VM, and the disk space allocated to that VM. This way, you can identify the VMs that have been configured with the maximum memory and disk space, and the VM that is over-utilizing the assigned memory.
Figure 14 : The detailed diagnosis of the Total memory measure reported by the SCVMM Hosts test
You can use the detailed diagnosis of the Disk space reserve measure to know how much disk I/O is utilized by each VM on the host. This will point you to the exact VM that is excessively utilizing the disk I/O resources.
![]()
Figure 15 : The detailed diagnosis of the Disk space reserve measure
You can use the detailed diagnosis of the Network reserve measure to know how each VM on the host is utilizing the network resources. This way, you can quickly identify VMs that are hogging the network resources of the host.
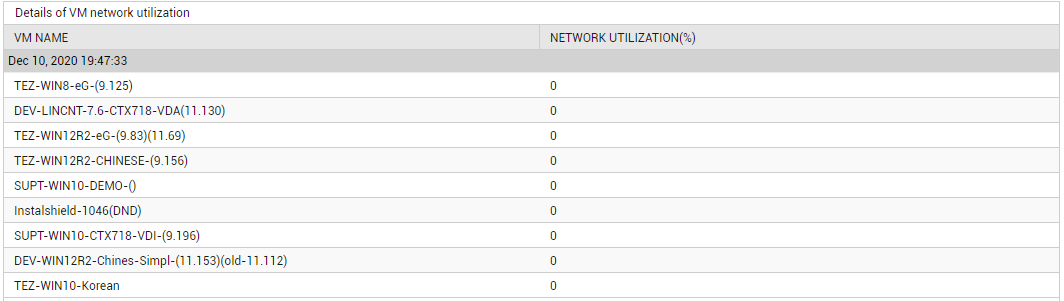
Figure 16 : The detailed diagnosis of the Network reserve measure
Use the detailed diagnosis of the Powered on VMs measure to know which VMs on the host are powered on.
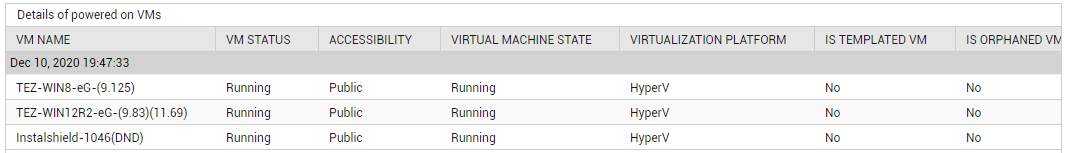
Figure 17 : The detailed diagnosis of the Powered on VMs measure reported by the SCVMM Hosts test
Use the detailed diagnosis of the Powered off VMs measure to know which VMs on the host are powered off.
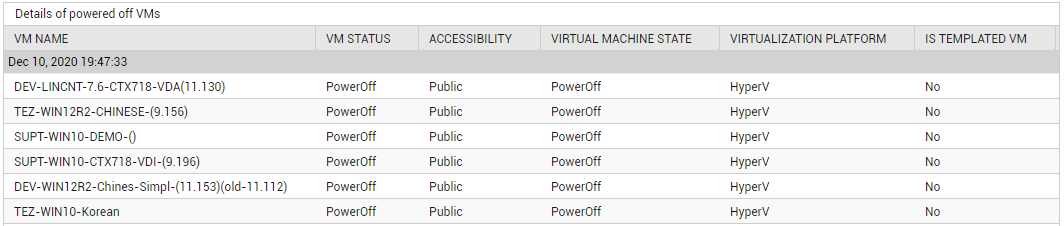
Figure 18 : The detailed diagnosis of the Powered off VMs measure reported by the SCVMM Hosts test