SQL Integration Pipeline Test
The Data Flow task is like a pipeline for data, which moves data between sources and destinations, and lets the user transform, clean, and modify data as it is moved.
A data flow consists of at least one data flow component, but it is typically a set of connected data flow components: sources that extract data; transformations that modify, route, or summarize data; and destinations that load data. In short, each of the data flow components is classified into one of three categories: sources, destinations, and transformations. Most data flows consist of at least one source and one destination, and optionally contain one or more transformations. Figure 4 shows an example of a simple data flow design with an OLE DB source connecting to a SQL Server table, using a derived column transformation to trim the whitespace from each character field and then writing the data to a flat file destination.
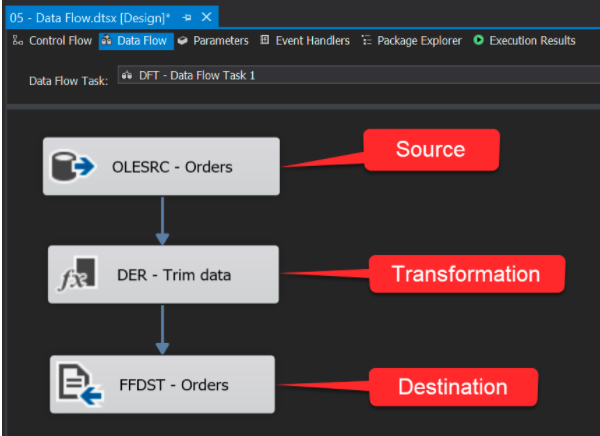
Figure 4 : A sample data flow layout
At run time, the Data Flow task builds an execution plan from the data flow, and the data flow engine executes the plan. Based on the execution plan, the data flow task creates buffers that contain the columns defined in the outputs of the data flow components. The buffer is reused as the data flows through the sequence of components, until a component with asynchronous outputs is encountered. Then, a new buffer is created, which contains the output columns of the asynchronous output and the output columns of downstream components.
Typically, for data flows with five or six components with small data loads of a gigabyte or less, the Data flow Task will almost certainly perform adequately out-of-the-box. However, heavy and complex data flow loads bring their own challenges. Such workloads can cause a large amount of buffer memory to be consumed when data flow tasks are in progress. Excessive buffer memory consumption can increase memory swapping, thus crippling the performance of the engine! To optimize the engine's performance and speed up data processing by the engine, administrators need to continuously track the amount of buffer memory consumed when different data flow components are at work, rapidly determine if the engine is memory-hungry, and see what data flow settings can be altered to cut memory usage and enhance performance. The insights provided by the SQL Integration Pipeline test help administrators achieve the above!
This test monitors the data extracted from sources, modified using transformations, and uploaded to destinations. The buffer memory used during these processes is measured, and administrators proactively alerted to unusually high memory usage. With the help of these metrics, administrators can figure out how the data flow configuration can be fine-tuned, so that buffer memory consumption is kept at a minimum. The test also reveals if the engine is processing resource-intensive BLOBs or too many rows of data, thereby enabling administrators to focus on other factors that can impact processing time.
Target of the test : A Microsoft SQL Server Integration Services server
Agent deploying the test : An internal agent
Outputs of the test : One set of results for the server being monitored
| Parameters | Description |
|---|---|
|
Test period |
How often should the test be executed |
|
Host |
The host for which the test is to be configured. |
|
Port |
The port at which the specified Host listens. |
|
SSIS Version |
The eG agent runs queries on the Microsoft SQL server on which the SQL Server Integration Services (SSIS) are installed to pull the desired metrics. To enable the eG agent to run these queries, you need to configure the test with the version of SSIS that is in use in your environment. To know how to determine the SSIS version, refer to Configuring the eG Agent with the SSIS Version. Once the version number is ascertained, make sure you specify the exact number here. |
| Measurement | Description | Measurement Unit | Interpretation |
|---|---|---|---|
|
BLOB data read |
Indicates the amount of binary large object (BLOB) data that the data flow engine has read from all sources. |
MB |
The Blob object represents a blob, which is a file-like object of immutable, raw data; they can be read as text or binary data, or converted into a ReadableStream so its methods can be used for processing the data. As Binary Large Objects (BLOBs) are particularly burdensome to the data flow task , a low value is hence desired for these measures. BLOB-based temporary data can easily overwhelm one single buffer during the execution of packages, so, the temporary storage is needed to be set just for BLOBs processing. It could slip over to the logical disk storage, if physical RAM is 100% allocated, which slows down the performance of SSIS Pipeline. In order to optimize the usage of that data during the package execution, the BLOBTempStoragePath in parallel with the BufferTempStoragePath properties should be set for particular columns that contain BLOBs, otherwise, the default values will be applied for TEMP variables. |
|
BLOB data written |
Indicates the amount of BLOB data that the data flow engine has written to all destinations. |
MB |
|
|
BLOB files in use |
Indicates the number of BLOB files that the data flow engine currently is using for spooling. |
Number |
|
|
Buffer memory |
Indicates the amount of physical and virtual memory used by the data flow engine. |
MB |
As mentioned already, buffers are objects with associated chunks of memory that contain the data to be transformed. As data flows through the Dataflow Task, it lives in a buffer from the time that the source adapter reads it until the time that the destination adapter writes it. When the value of this measure is larger than the amount of physical memory, then check the value of the Buffers spooled measure. If the Buffers spooled count also rises in tandem with the value of the Buffer memory measure, it is an indication that memory swapping is increasing. Increased memory swapping slows performance of the data flow engine. To avoid this, you may want to right-size the buffer by increasing the DefaultBufferSize and DefaultBufferMaxRows settings of the data flow engine. DefaultBufferSize is the default size of a buffer which is set to 10MB. DefaultBufferMaxRows is the default number of rows the data flow will try to put in a buffer. This is set to 10,000 rows. When calculating the buffer size, the data flow uses these two properties. If one property is reached, the size of the buffer is not further enlarged. For example, if the row size is 1MB, the data flow wil put 10 rows into the buffer, since the maximum buffer size will then be met. If the row size is only 1KB, the data flow will use the maximum of 10,000 rows. However, you should avoid increasing the values too much to the point where the Execution Engine starts swapping out buffers to disk. That would defeat the purpose. Alternatively, you can set the AutoAdjustBufferSize property to True. If this is done, then the size of the buffer will be automatically adjusted so that the DefaultBufferMaxRows setting is met. For example, if you have set it to 40,000 rows, the data flow will automatically scale the buffer size so that the buffers will contain 40,000 rows. |
|
Buffers in use |
Indicates the amount of buffer memory that all data flow components and the data flow engine is currently using. |
MB |
A low value is desired for the measure. A consistent increase in the value of the measure is indicative of abnormal buffer usage by the data flow engine. |
|
Free buffer |
Indicates the amount of buffer memory that is still to be used by the engine. |
MB |
A high value is desired for this measure. If free memory is consistently eroded, it implies that the data flow engine is memory-hungry. |
|
Buffer memory usage |
Indicates the percentage of buffer memory currently used by the data flow engine and its components. |
Percent |
A low value is desired for this measure. A steady increase in the value of this measure is indicative of excessive memory usage, which in turn can degrade the performance of the data flow engine. |
|
Buffers spooled |
Indicates the number of buffers currently written to the disk. |
Number |
If the data flow engine runs low on physical memory, buffers not currently used are written to disk and then reloaded when needed. This is called buffer spooling. If the value of this measure increases alongside the value of the Buffer memory measure, it is an indication that memory swapping is increasing. Increased memory swapping slows performance of the data flow engine. |
|
Flat buffer memory |
Indicates the total amount of memory, in bytes, that all flat buffers use. |
MB |
Flat buffers are blocks of memory that a component uses to store data. A flat buffer is a large block of bytes that is accessed byte by byte. |
|
Flat buffers in use |
Indicates the amount of flat buffer memory that the data flow engine presently uses. |
MB |
A low value is desired for the measure. A consistent increase in the value of the measure is indicative of abnormal buffer usage by the data flow engine. |
|
Free flat buffer memory |
Indicates how much flat buffer memory is currently unused. |
MB |
A high value is desired for this measure. A steady drop in this value indicates that one/more data flow components are over-utilizing the flat buffers. |
|
Flat buffer memory usage percent |
Indicates the percentage of flat buffer memory that is currently in use. |
Percent |
A value close to 100% is a cause for concern, as it implies that the data flow components are rapidly running out of flat buffers that they can use to store data. |
|
Private buffer memory |
Indicates the total amount of memory used by all private buffers. |
MB |
A buffer is not private if the data flow engine creates it to support data flow. A private buffer is a buffer that a transformation uses for temporary work only. For example, the Aggregation transformation uses private buffers to do its work. |
|
Private buffers in use |
Indicates the amount of private buffer memory that transformations are currently using. |
MB |
A low value is desired for the measure. A consistent increase in the value of the measure is indicative of abnormal buffer usage by the data flow engine. |
|
Free private buffer memory |
Indicates the amount of private buffer memory that is unused. |
MB |
A high value is desired for this measure. A steady drop in this value indicates that transformations are probably over-utilizing the private buffers. |
|
Private buffer memory usage |
Indicates the percentage of private buffer memory that is currently in use. |
Percent |
A value close to 100% is a cause for concern, as it implies that transformations may soon not have enough memory to carry out data modifications. This can slow down data flow processing. |
|
Rows read |
Indicates the number of rows that a source produces. |
Number |
This number does not include rows read from reference tables by the Lookup transformation. |
|
Rows written |
Indicates the number of rows offered to a destination. |
Number |
This number does not reflect rows written to the destination data store. Using the values of the Rows read and Rows written measures, you can gauge the overall progress of the data flow and use them to perform sanity checks. For example, as you increase the number of rows a data flow processes, you would expect a commensurate increase in processing time. These measurements help you quickly determine if the increased processing times are warranted. |