Monitoring Business Services
If you have configured one/more business services for monitoring in eG Enterprise, then post the integration with SCOM, you can use SCOM to view the current state of these business services. Moreover, in the event of a service slowdown/outage, you can even view and analyze the service topology in the SCOM console itself, and isolate the service component that could have caused the abnormality, without launching the eG monitoring console!
To achieve this, you will have to login to the SCOM console and recreate the topology of each business service that you want monitored. To help you understand this process better, let us take the example of the infomart service. Figure 1 below depicts the topology of this service.
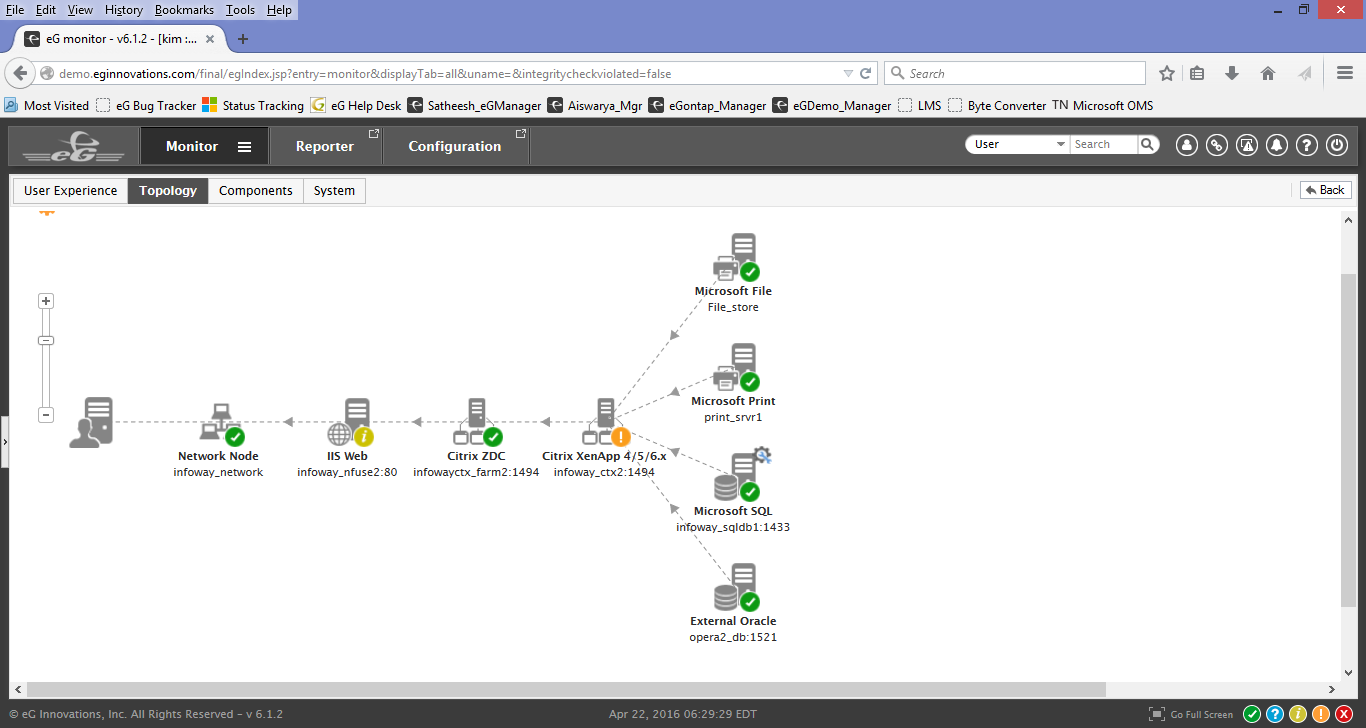
Figure 1 : The topology of the Infomart service as viewed in the eG web interface
The Infomart service, as you can see, is a virtualized Citrix XenApp service, where the XenApp server, Infoway_ctx2:1494, is running on a VM configured on the ESXi server, nyc_vm_02. Users login to the Citrix farm via the Citrix web interface hosted on the IIS web server, infoway_nfuse2:80. The Citrix ZDC, infowayctx_farm2:1494, that balances the load on the farm, receives the user request and transmits it to the least-loaded XenApp server, infoway_ctx2:1494, in the farm. The XenApp server services the user request by taking help from the MSSQL database server, External Oracle server, an MS File sever, and the Print server.
To build the topology of the Infomart service in the SCOM console, do the following:
-
A business service in eG has to be defined as a ‘Distributed Application’ in SCOM. In other words, the Infomart service in our example, will have to be configured as the Infomart distributed application in SCOM. This implies that the topology that you built for the Infomart service in eG should be built again in SCOM for the Infomart distributed application. For this, first, login to the SCOM console. Then, click the Authoring tab page depicted by Figure 2 below.
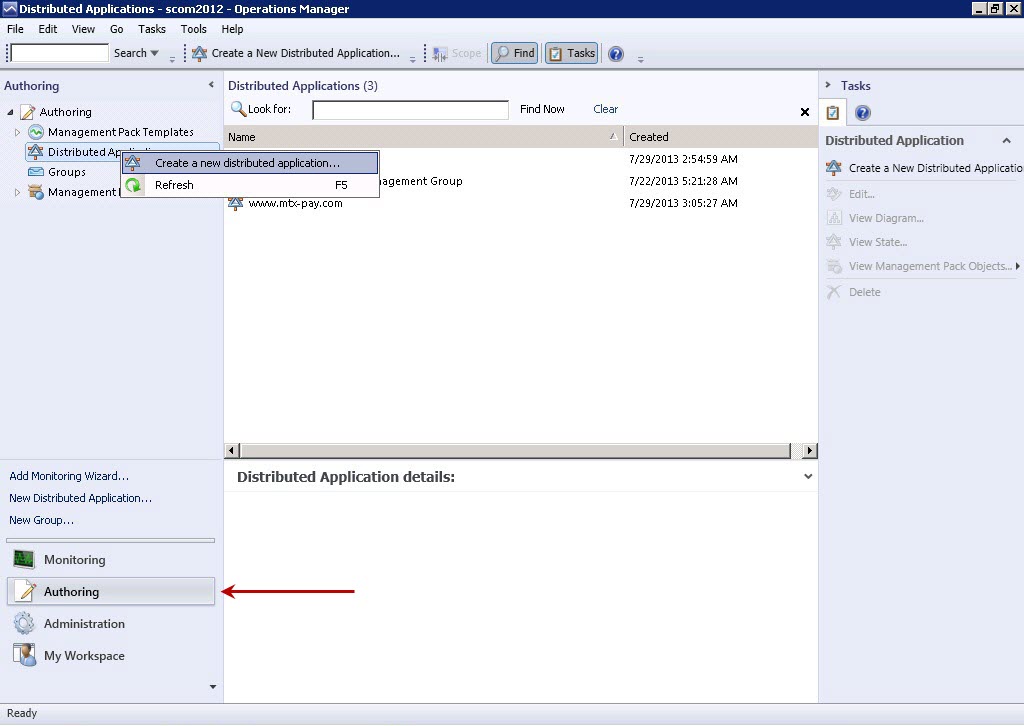
- When the Authoring tree appears in the left panel, expand the Authoring node in the tree-structure, right-click on the Distributed Application sub-node, and pick the Create a new distributed application option (see Figure 2).
-
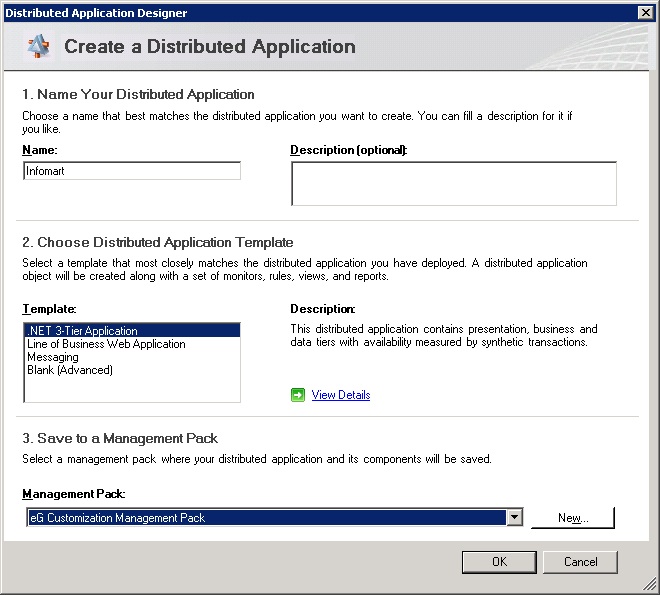
Figure 3 then appears.
-
In the Name Your Distributed Application section of Figure 3, provide a uniqe Name to your distributed application – for easy identification, its best to name the distributed application after the business service it corresponds to. In the case of our example therefore, set Infomart as the Name of the distributed application. Next, select the .NET 3-Tier Application option from the Template list in the Choose Distributed Application Template section, and pick the eG Customization Management Pack option from the Management Pack drop-down in the Save to a Management Pack section. Finally, click the ok button in Figure 3. This will invoke the Distributed Application Designer window (see Figure 4).
-
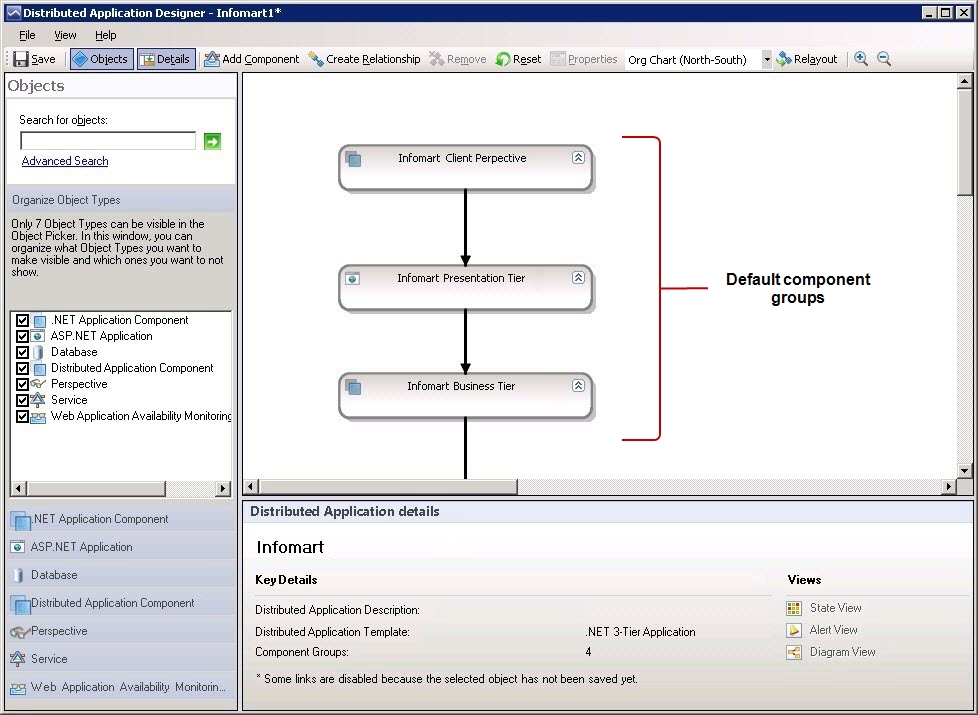
The Distributed Application Designer window will display a default template for constructing the topology of the distributed application. Each ‘box’ in the default template represents a default component group that you can use in your service topology. As we do not intend to use this default template, delete it by selecting every ‘box’ in the template and pressing the Delete button on the keyboard. Once all the default component groups are removed, you can proceed to add new component groups (see Figure 5) using the Distributed Application Designer window.
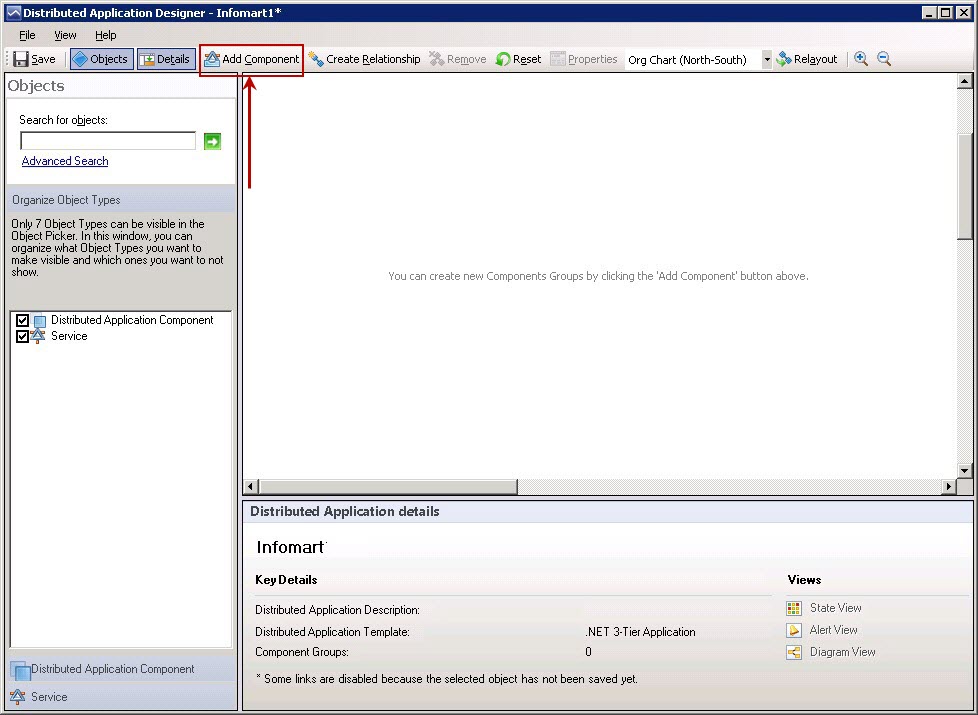
Figure 5 : A message indicating that new component groups have to be added
-
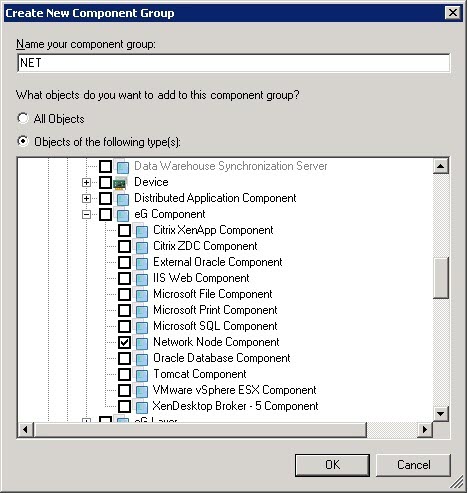
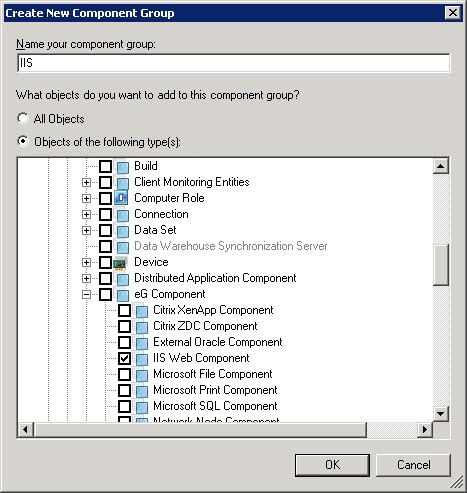
To add a new component group, click on the Add Component button indicated by Figure 5. The Create New Component Group dialog box will then appear (see Figure 6). Let us begin topology building by adding the Network Node component in our example, infoway_network. For this, first create the Network Node component group using Figure 6 and then add the infoway_network component to it. To achieve this, first specify the name that you wish to assign to the Network Node component group in the Name your component group text box in Figure 6. For the purpose of our example, let us name this group, net. Then, pick the Objects of the following type(s) option in Figure 6 and then scroll down the tree-structure below until you find the eG Component node (see Figure 7). Expand the node, and pick the Network Node Component group by selecting the check box alongside. Then, click the ok button in Figure 7.
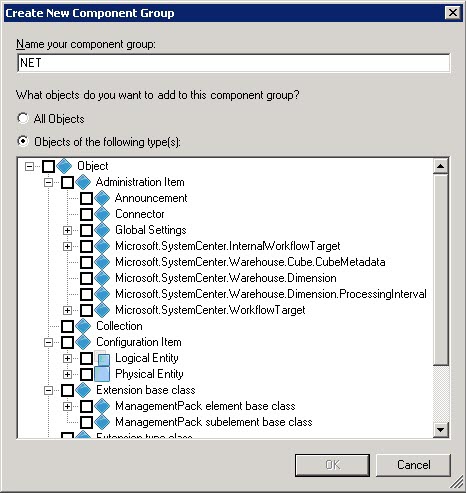
Figure 6 : Naming the component group
-
This will invoke Figure 8. In the Distributed Application Designer window of Figure 8, you will find a ‘box’ representing the new net component group that you just added.
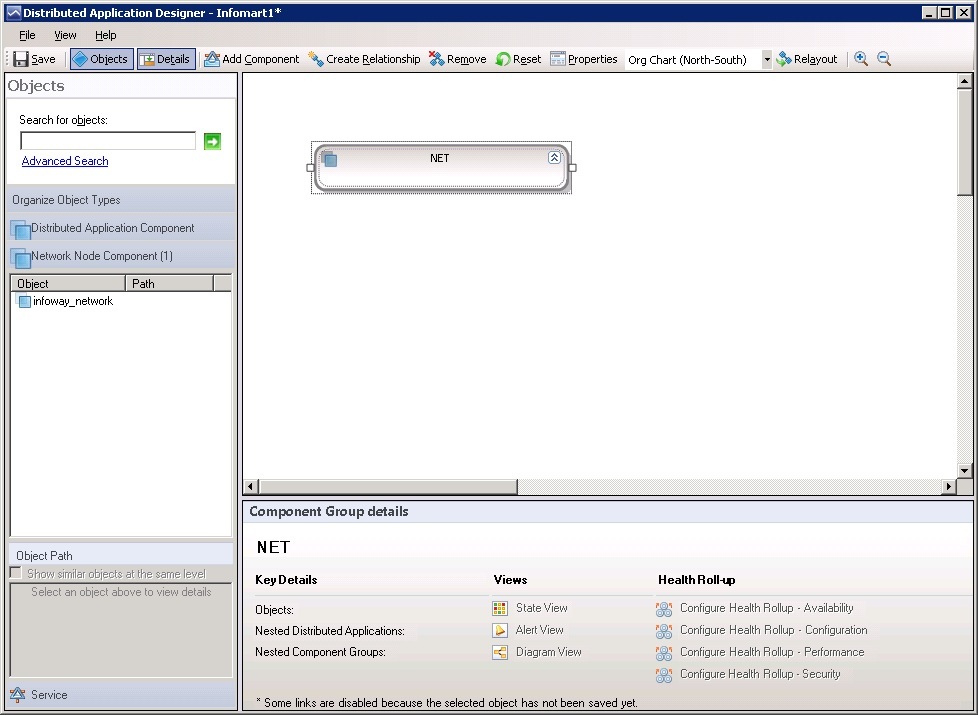
Figure 8 : The newly added Network Node Component group appearing in the Designer window
-
Next, click on the Network Node Component section in the left panel of Figure 8 (as indicated), to view all the eG-managed network nodes. From the list that appears beneath, select the infoway_network component, drag it, and drop it into the net box in the right panel (see Figure 9).
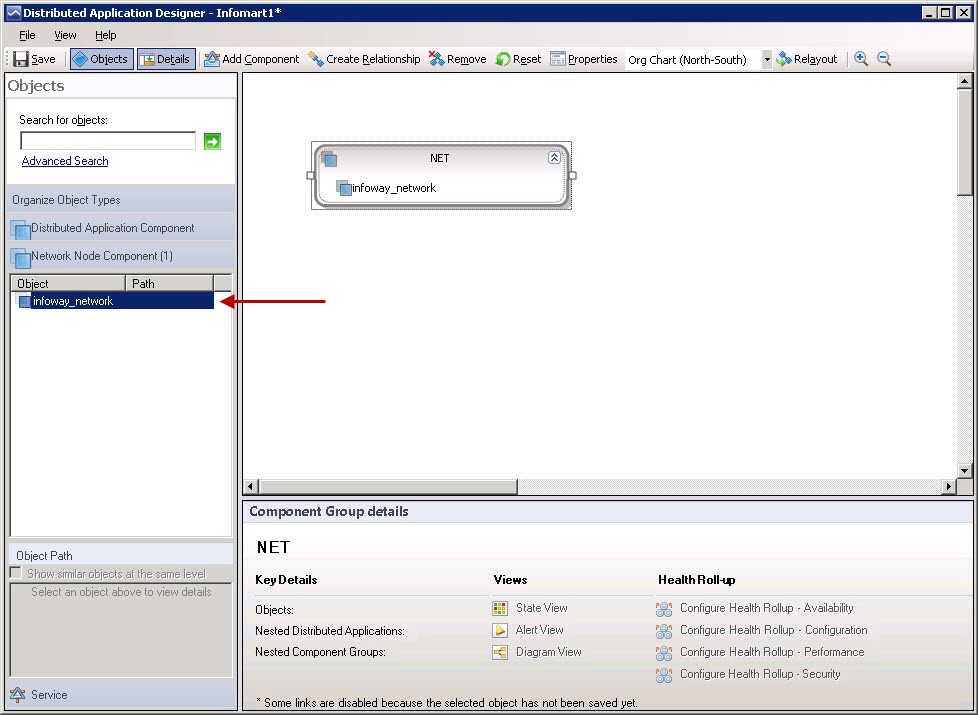
Figure 9 : Adding the infoway_network component to the NET component group you created
-
With that, the Network Node Component group has been created, and the infoway_network component has been added to it. The next step is to create the IIS web server component and configure a relationship between the network node and the web server. For this, click on the Add Component button in Figure 9 again. When the Create New Component Group dialog box of Figure 10 appears, name the new component group as iis, select the Object of the following type(s) option, scroll down the object type list, expand the eG Component node, and select the IIS Web Component group.
-
The Distributed Application Designer window now reappears displaying a separate box for the iis component group that you just created (see Figure 11). In the left panel of Figure 11, click on the IIS Web Component section (as indicated), select the infoway_nfuse2:80 component from the web server list that appears, drag it, and drop it into the iis box (as shown by Figure 12).
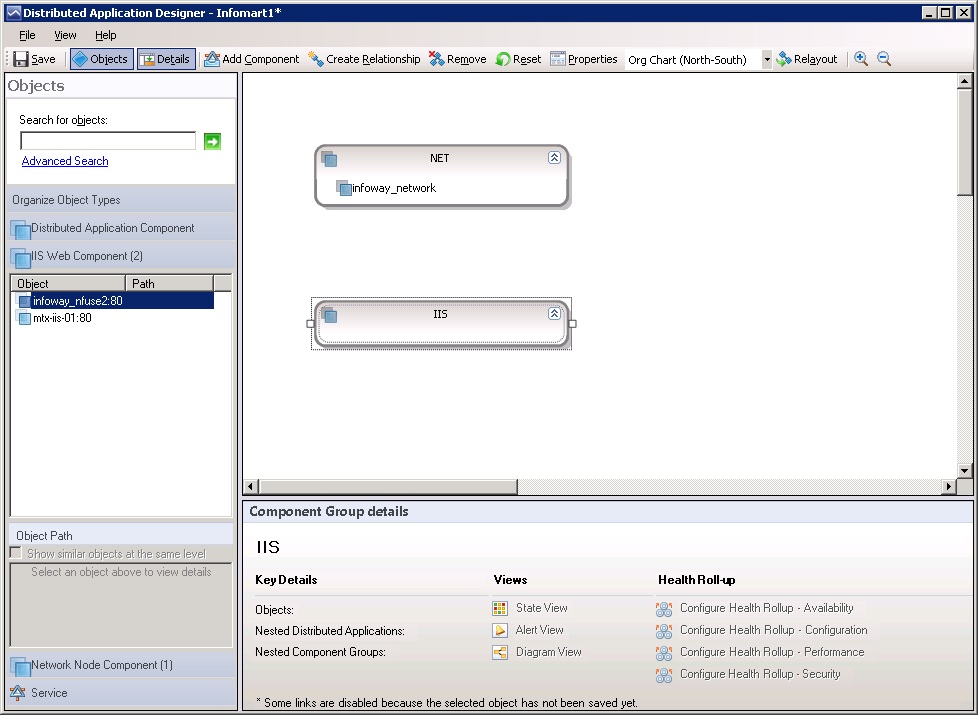
Figure 11 : The IIS Web Component group appearing in the Designer window
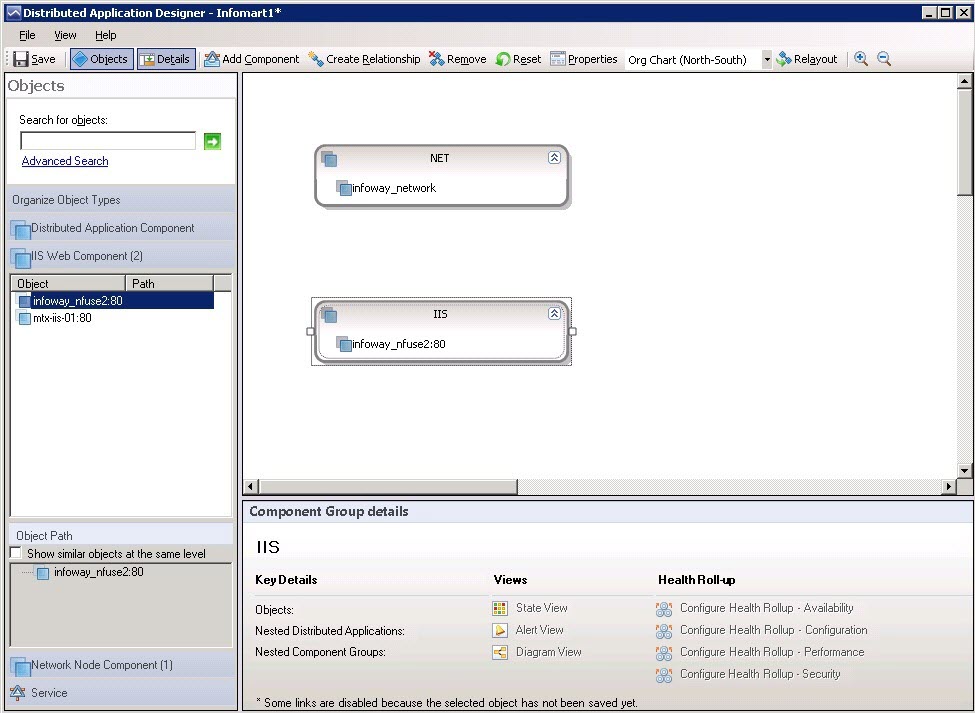
Figure 12 : Adding the infoway_nfuse2:80 component to the IIS component group
-
Now, proceed to create a relationship between the IIS web component and the Network node component. For this, click on the Create Relationship button in Figure 12, and then draw an arrow connecting the iis box in the Designer window with the net box, as depicted by Figure 13. Since iis is dependent on the net component in our example for its functioning, the direction of the arrow should indicate the ‘Uses’ relationship – i.e., the arrow head should face the net component. Once done, you can look up the Reference Details section of the Designer window to know whether the intended relationship has been established between the two components. For instance, in the case of our example, if this section displays the message, iis uses net, it is a clear indication that your ‘relationship configuration’ is correct.
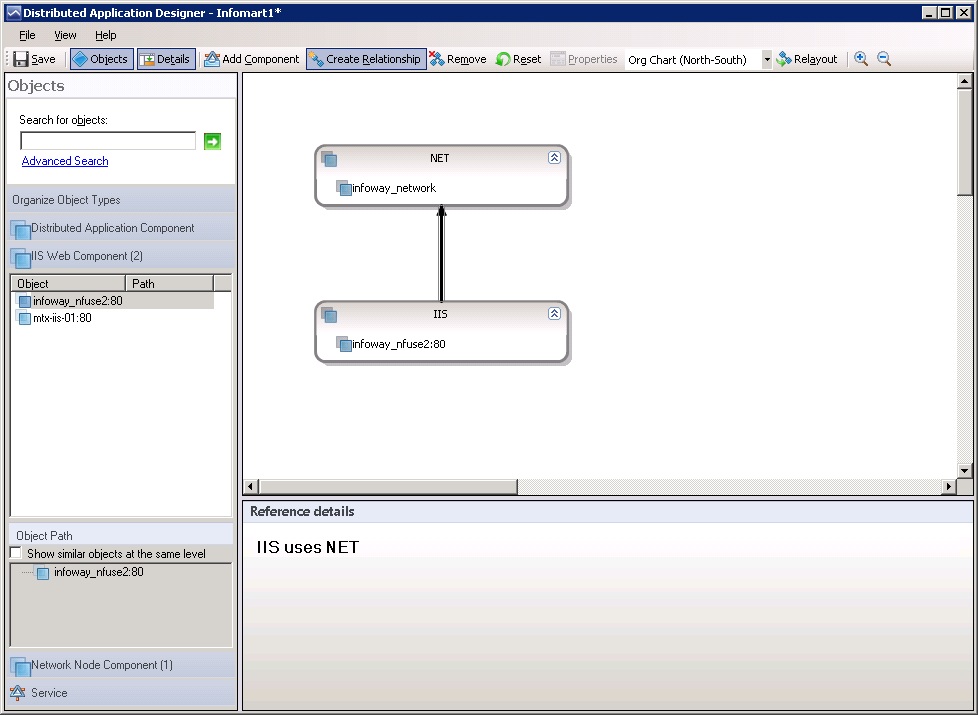
Figure 13 : Creating a relationship between the IIS and NET components
-
Likewise, proceed to add the other component groups and components as required by the Infomart application, and configure the same relationship between these components as depicted by the service topology preview of Figure 1. Figure 14 below depicts the final topology of the Infomart application.
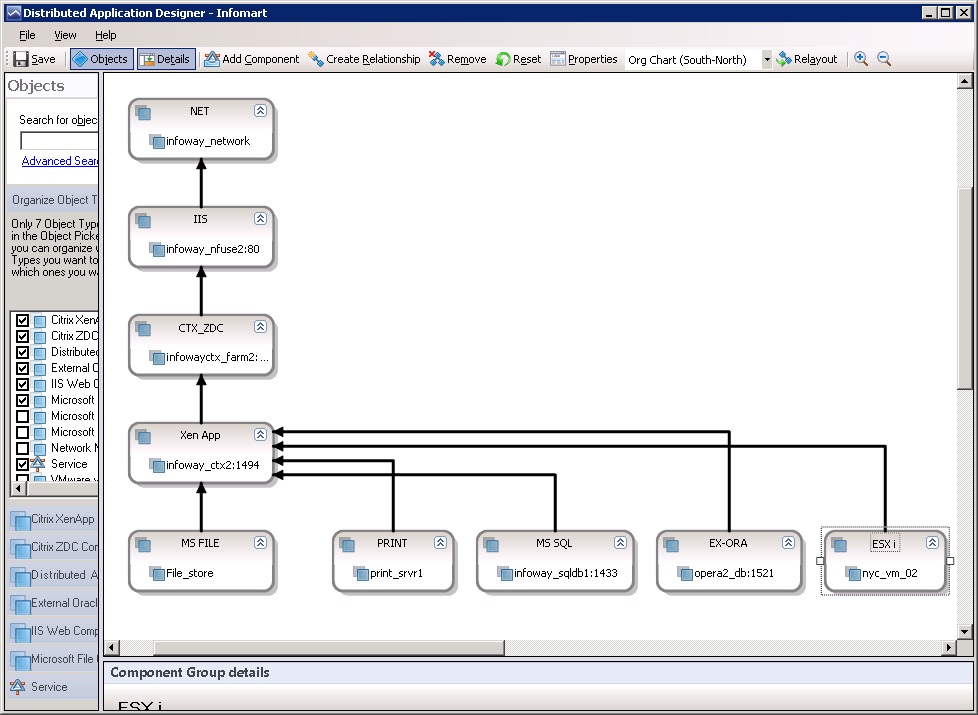
Figure 14 : The fully-configured topology of the Infomart distributed application
-
With that, the topology of the distributed application has been fully configured. Once eG Enterprise is integrated with SCOM, the SCOM connector updates the state of the distributed application and its member components based on state computations performed in eG. To view the current state of the Infomart application, move to the Monitoring view, by clicking on the Monitoring tab page indicated by Figure 15. Then, click on the Distributed Applications sub-node in the Monitoring tree-structure in the left panel of Figure 15.
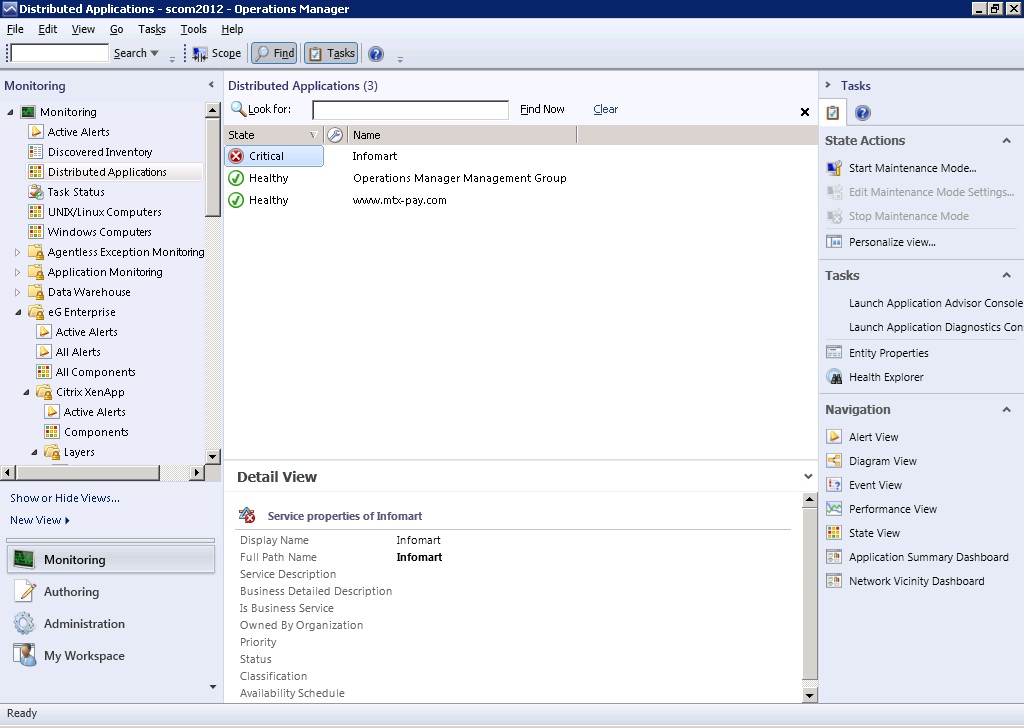
Figure 15 : Viewing the state of the Infomart distributed application in the Monitoring mode
-
The right panel of Figure 15 will then display all the Distributed Applications that have been configured and their current state. From Figure 15, it is evident that the Infomart application is in a Critical state. To know which component engaged in the delivery of the Infomart application is responsible for this Critical problem, view the topology map of the Infomart application. For this, right-click on the State of that application (which is currently, Critical), and follow the menu sequence: Open -> Diagram View (see Figure 16).
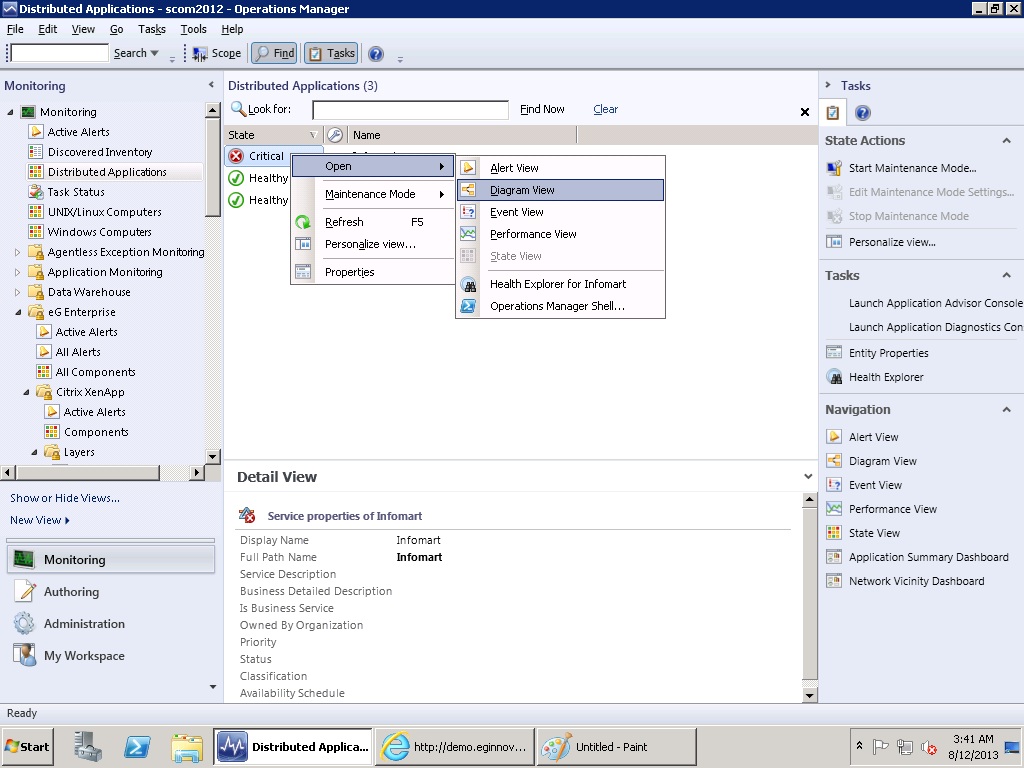
Figure 16 : Accessing the topology map of the Infomart application in the Monitoring mode
-
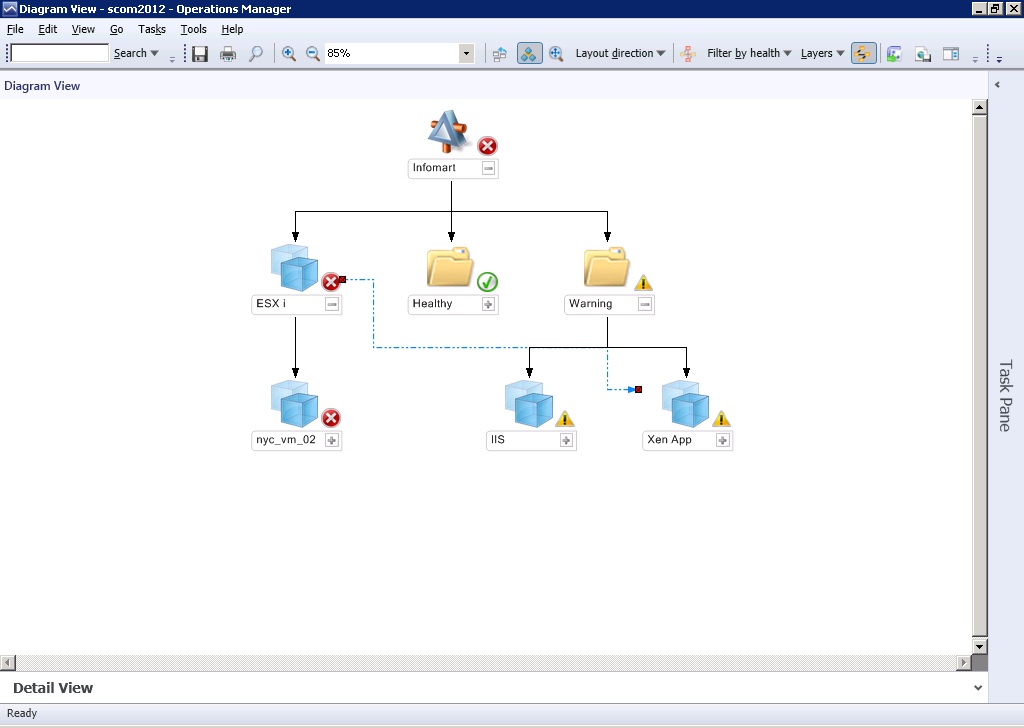
Figure 17 will then appear, displaying an ‘’abridged” topology of the Infomart application; this topology indicates that while a single component is in the Critical state, some components are in the Healthy state and some others in the Warning state. From Figure 17, we can easily infer that the ESXi component is in the Critical state and is hence responsible for the dip in the performance of the Infomart application. Could this Critical issue have caused some components to be in the Warning state? Only detailed investigation can confirm that. To begin with however, let us focus on the Critical issue with the esxi component.
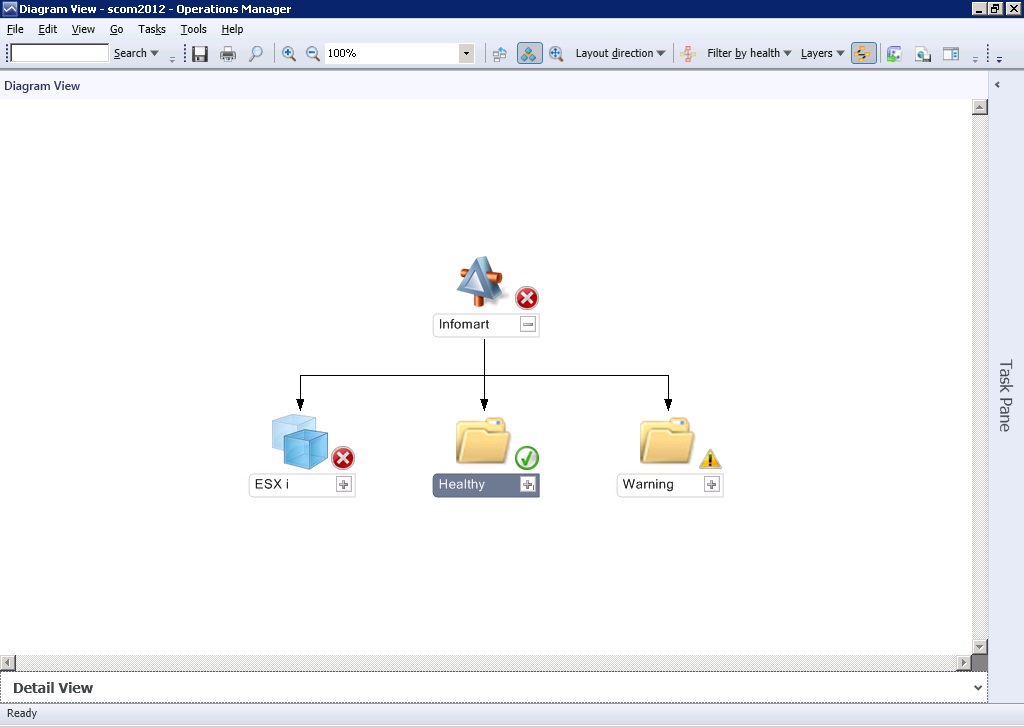
Figure 17 : The abridged distributed application topology indicating the component in the Critical state
-
From the topology map of Figure 17, you can drill down further to discover where in the ESXi component’s architecture the Critical issue occurred and which eG test caused it. To drill down, click on the + button adjacent to ESXi in Figure 17. This will reveal the name of the problematic ESXi component, which is nyc_vm_02 in the case of our example (see Figure 18). Clicking on the + button next to nyc_vm_02 will lead you to the layer in which the problem occurred – this is the Operating System layer in our example. By drilling one level down, will you can determine the exact test that reported the problem – this is the System – Console test in the case of our example. It is now apparent that the Critical anomaly occurred in the service console of the nyc_vm_02 component. From Figure 18, it is also clear that the Critical problem with the System-Console test has rippled and affected the performance of the CPU-Esx test, forcing SCOM to signal the problem with that test as a Warning. To know the exact measures that captured these abnormalities, you have to use SCOM’s Health Explorer. Refer to Section 3.6 of this document to know how to use the Health Explorer.
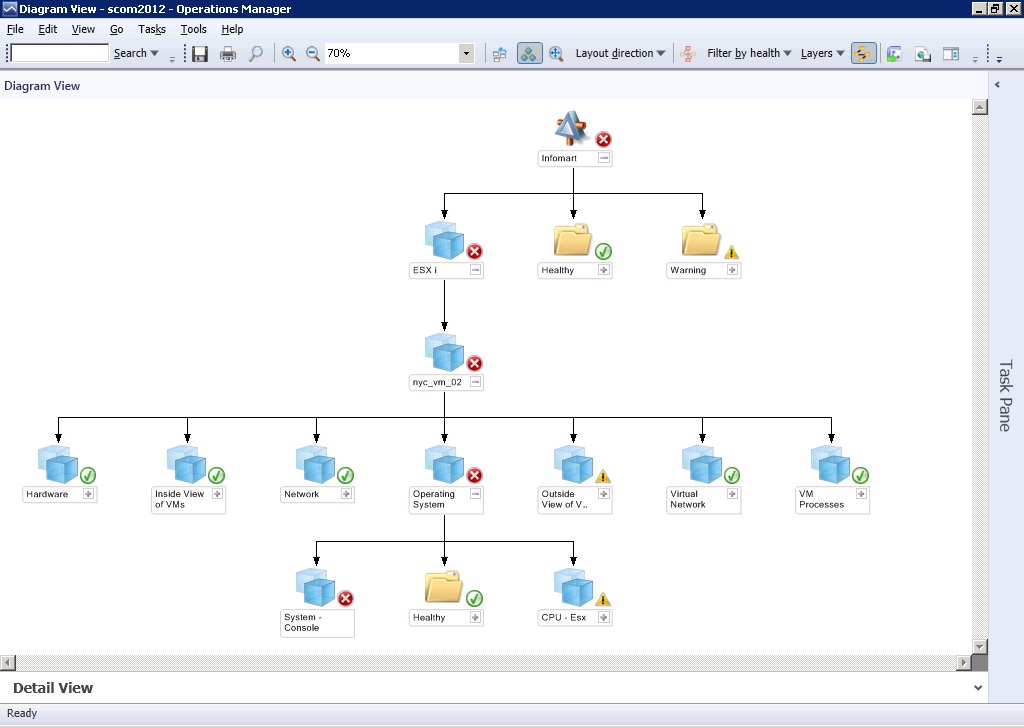
Figure 18 : Drilling down from the ESXi component to know which eG test reported the Critical problem
-
Now, let us drill down the Warning node under Infomart in the topology map. This reveals that the iis web server component and the XenApp server component in our example are currently in the Warning state, indicating that Major problems have been noticed in these two components. Also, the ‘dotted arrow’ in blue connecting the ESXi component and the XenApp component (see Figure 19) reveals that the XenApp server depends upon the ESXi server for its proper functioning; this implies that the Critical issue with the ESXi component impacted the performance of the XenApp server that was running on one of the VMs of the ESXi server, thus creating a Major problem with the XenApp server. This is how SCOM indicates cause-effect equations and helps you isolate the source of issues with your distributed applications –i.e., business services.