Publishing Dashboards
The SCOM console provides users with instant access to custom My Dashboards published from the eG monitoring console. This section explains the procedure for enabling access to these dashboards.
Pre-requisites for Publishing Custom My Dashboards in the SCOM Console
Before publishing the custom My Dashboards in the SCOM console, the following pre-requisites should be fulfilled:
- SCOM version should be SCOM 2012 SP1 with Update Rollup 6 (or above) (OR) SCOM 2012 R2 with Update Rollup 2 or above
- Make sure that the latest version of Microsoft.SystemCenter.Visualization.Library.mpb and Microsoft.SystemCenter.Visualization.Component.Library.mpb management packs are imported.
- My Dashboard names can include only the following characters: alphabets, integers, underscore (_), hyphen (-), and white spaces.
- Make sure that the My Dashboard is Published using the eG monitoring console before attempting to access it in the SCOM console.
-
By default, SCOM publishes dashboards to Internet Explorer v7. However, custom dashboards published using eG can be viewed only using Internet Explorer v10 (or above). To be able to view eG dashboards in the SCOM console, you first need to make sure that the SCOM console is registered with Internet Explorer v10 (or above). To achieve this, follow the steps below:
- On the SCOM connector host, open the command prompt as administrator and move to eGconsoletaskHandler setup installed directory.
-
Run the following command:
eGconsoletaskHandler.exe presetup
- Re-open the SCOM console.
Automated Dashboard Views
To view the custom My Dashboards, do the following once the aforesaid pre-requisites are fulfilled:
- Open the SCOM console.
-
Expand the eG Enterprise node in the left panel of the console. Then, expand the All Dashboards sub-node within. This will reveal the My Dashboard node. Expand this node to view all the My Dashboards created by or shared with the user whose credentials were used for integrating the eG manager with SCOM. To view a dashboard, click on it. The dashboard will then be displayed in the left panel (see Figure 1).
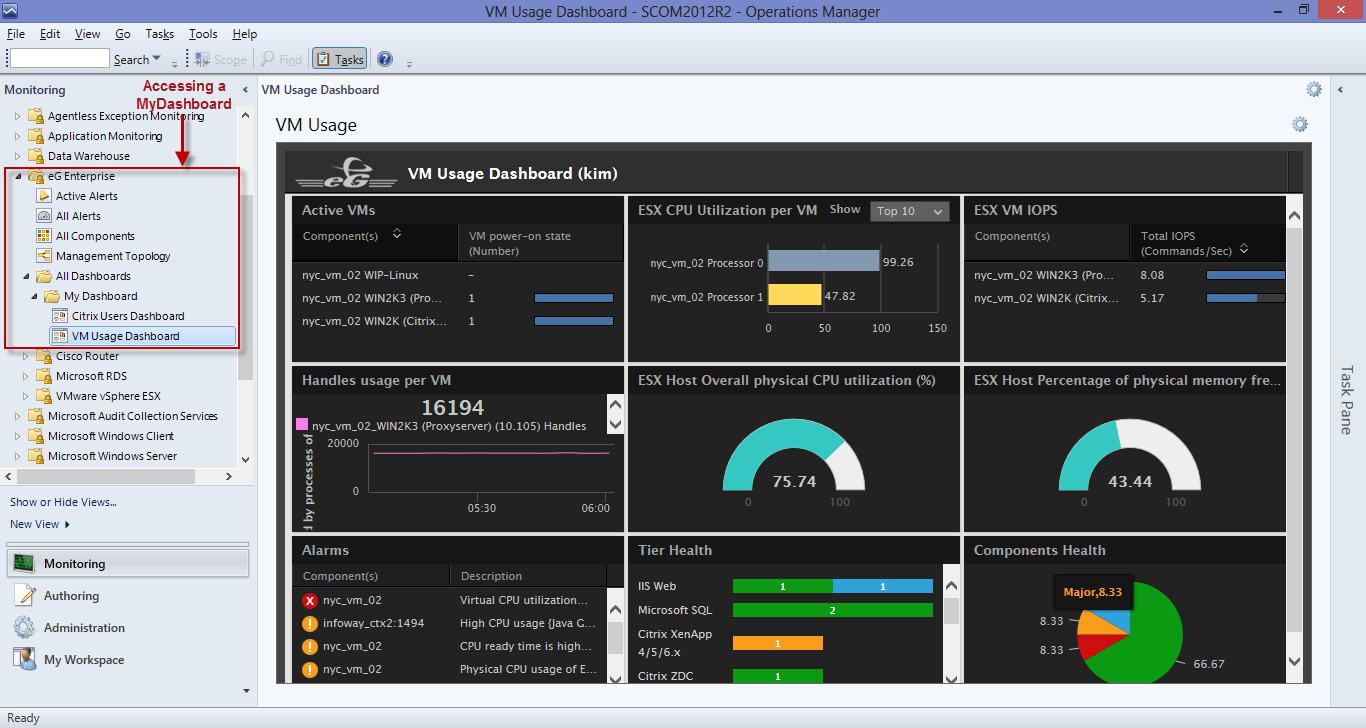
Figure 1 : Viewing a custom My Dashboard in the SCOM console