Viewing Infrastructure Health
The SCOM console also provides a more graphical, end-to-end view of the eG-managed infrastructure via its topology representation. To obtain this view, do the following:
-
Click the Management Topology node below the All Components node (see Figure 1). The right panel will then display the topology representation depicted by Figure 1. From the topology, it is clear that the eG-managed infrastructure is currently in a Critical state, because one of the servers in the infrastructure – namely, the VMware vSphere server – is experiencing Critical issues.
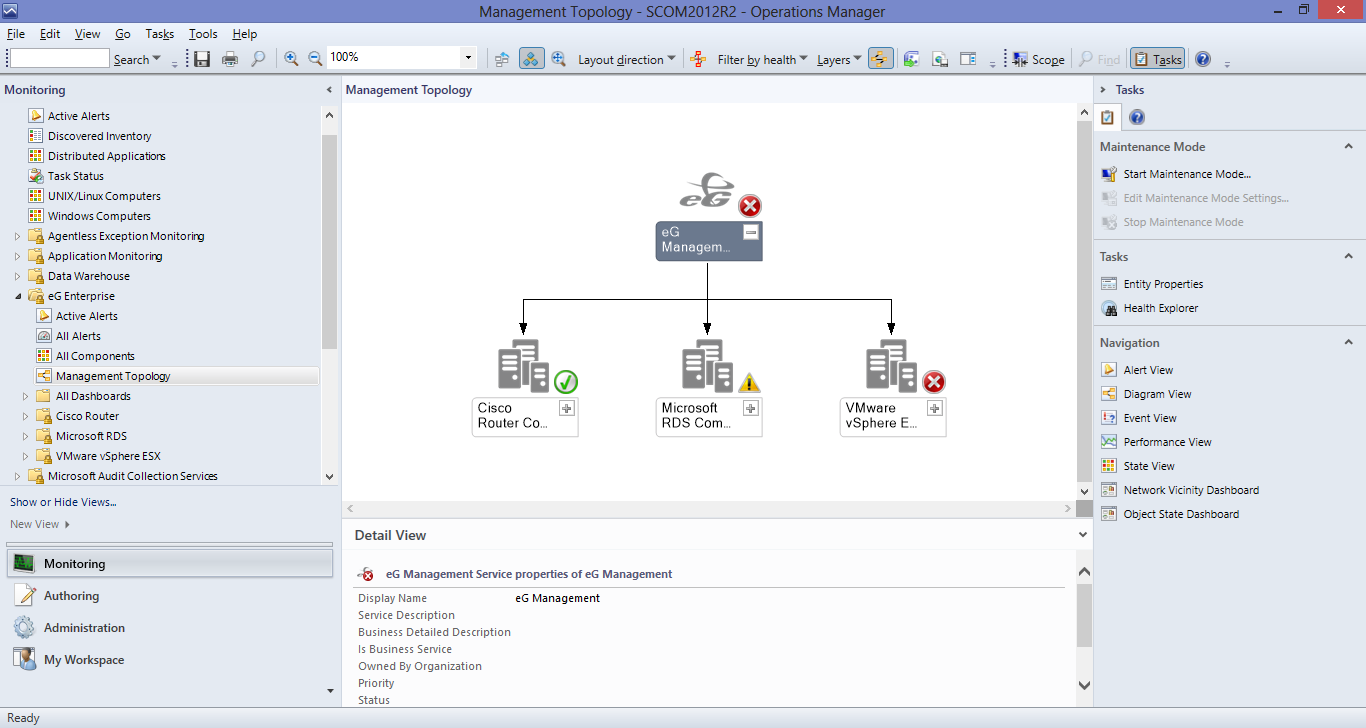
Figure 1 : The Management Topology of the eG-managed infrastructure
-
You can also drill-down from the high-level topology view of Figure 1 to identify the vSphere server that is experiencing the Critical issues and to zero-in on the precise problems that are impacting this server’s performance. For this click on the ‘+’ icon alongside VMware vSphere ESX in Figure 1. Figure 2 will then appear.
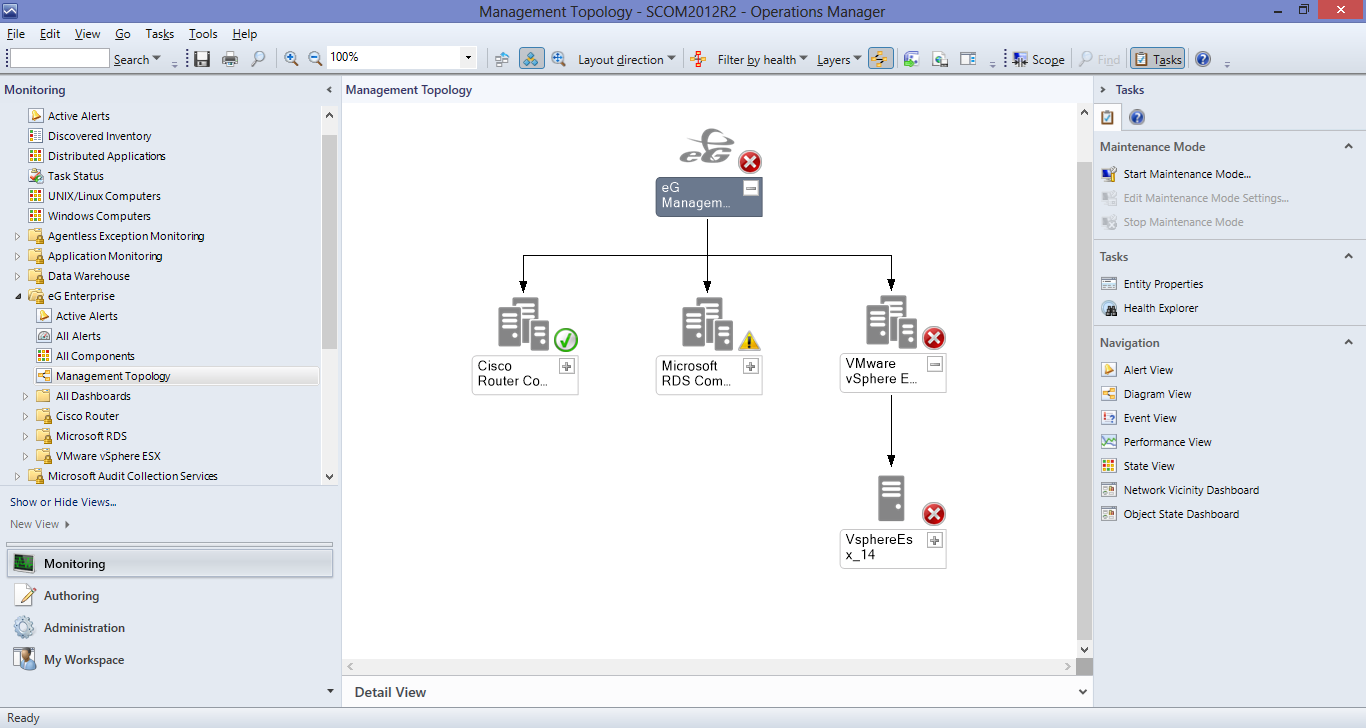
Figure 2 : Drilling down from the high-level topology view to know which VMware vSphere server is in a Critical state
-
Figure 2 reveals that the vSphere server, VsphereEsx_14, is the only vSphere server that is managed in the environment, and is currently in a Critical state. To identify the exact layer where the Critical issue occurred, drill down from the component view by clicking on the ‘+’ icon alongside VsphereEsx_14. Figure 3 will then appear displaying the layers of eG’s specialized layer model for VMware vSphere ESX. From the state of the layers, it is clear that Critical issues have occurred in network layer. If you now drill down from the network layer by clicking on the ‘+’ icon alongside, you can identify the exact test that reported the Critical problem. In the case of our example, the Network test seems to have captured a Critical issue; this implies that a critical network-related issue is what caused the performance of the VMware vSphere server to suffer.
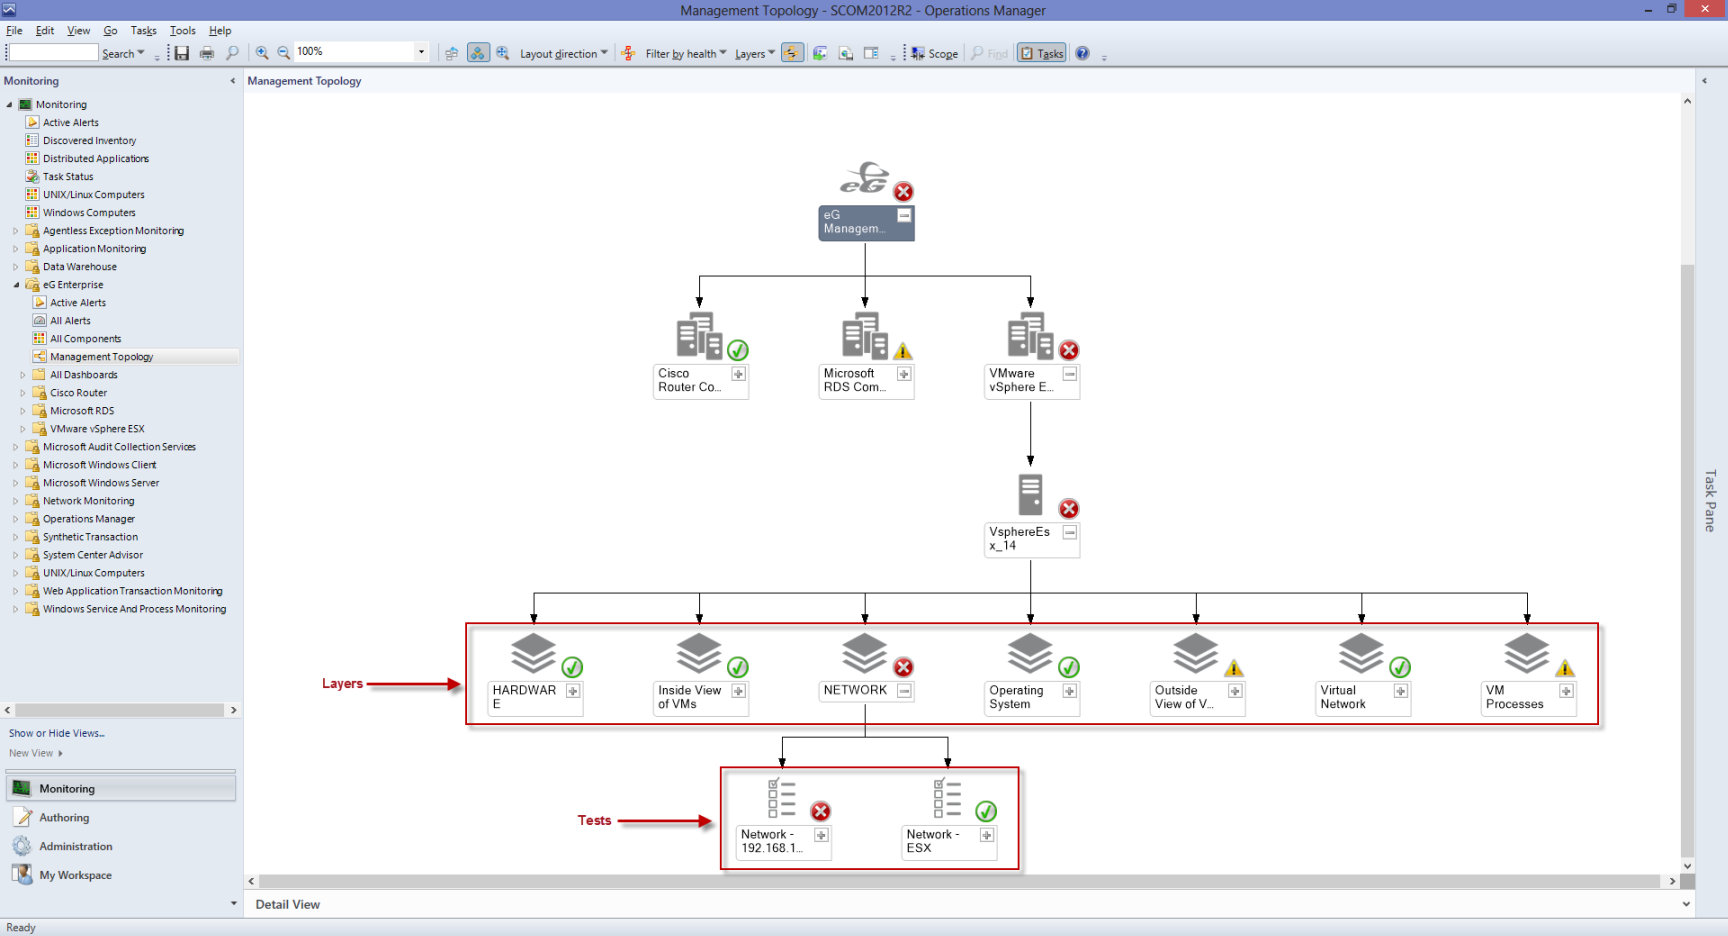
Figure 3 : Isolating the layer and test that reported the Critical issue
-
To zero-in on the precise issue, right-click on the Network test representation in the topology and pick the Health Explorer option. Figure 4 will then appear pointing you to the exact measure that deviated from the threshold and caused the Critical problem. As can be inferred from Figure 4, a high packet loss on the network link to the VMware vSphere ESX server is what led to the Critical state of the vSphere server.
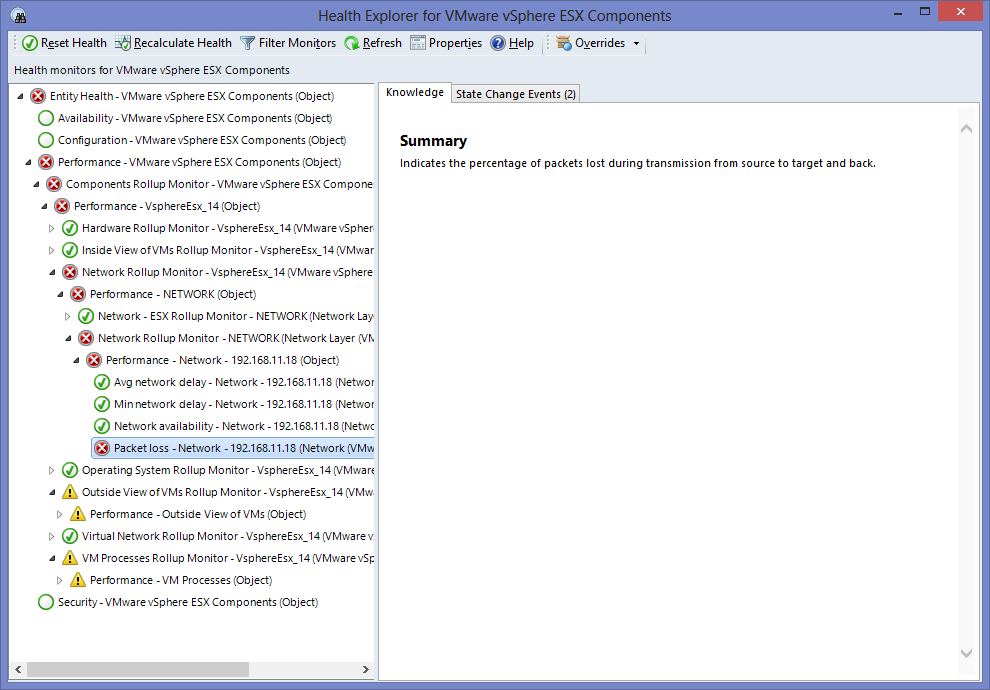
Figure 4 : Health Explorer revealing the accurate reason for the Network problem with the VMware vSphere ESX server