SharePoint Online Dashboard
The SharePoint Online Dashboard provides an at-a-glance look at the overall health and usage of the SharePoint Online service. The different pages of this dashboard help you find quick and accurate answers to the following questions:
- Is the SharePoint Online service healthy? If not, then what type of service incidents are affecting the health of the service?
- Is logging into the service failing frequently/taking too much time?
- Are there any unavailable and/or poorly responsive SharePoint sites?
- Are there sites nearing their storage quota?
- What type of operations are frequently performed on SharePoint Online?
- Is any user performing an abnormal number of operations on the service? Which particular operation is this?
To access the dashboard, click on the Monitor tile and select Microsoft Office 365 from the Dashboards menu. Then, move your mouse pointer over the SharePoint Online icon in the left panel of the page that appears, and select the Overview option within.
To view this dashboard for a particular tenant, choose that tenant from the Tenant list box at the right, top corner.
Overview
The Overview page provides an overview of the health of the SharePoint Online service and sites configured on it (see Figure 1).
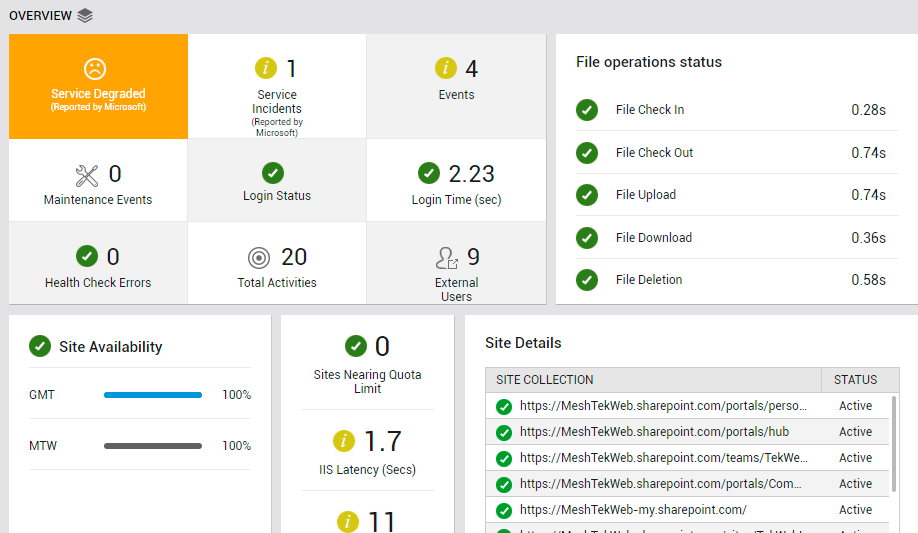
Figure 1 : The OVERVIEW page of the SharePoint Online dashboard
To access the Overview page, move your mouse pointer over the SharePoint Online icon in the left panel, and click on the Overview option within.
The service health indicator in this page indicates how healthy the SharePoint Online service is currently, using conventional color codes and visual representations. If the service is in a degraded state, then you can tell if service incidents are impacting service health by checking the value of the Service Incidents measure displayed in this page. If this display reports a non-zero value, then click on Service Incidents to know what incidents occurred. The List of Service Incidents table (see Figure 2) in this page will then appear reporting the service incidents.
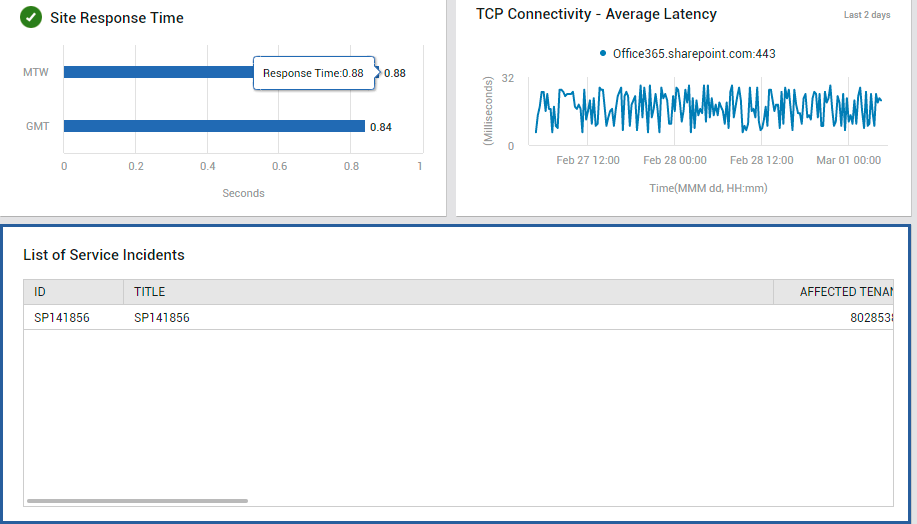
Figure 2 : The List of Service Incidents table that appears when the Service Incidents counter in the OVERVIEW page is clicked
Problem Events related to SharePoint Online are also revealed by this page. Click on Events to know what those events are and when they occurred (see Figure 3).
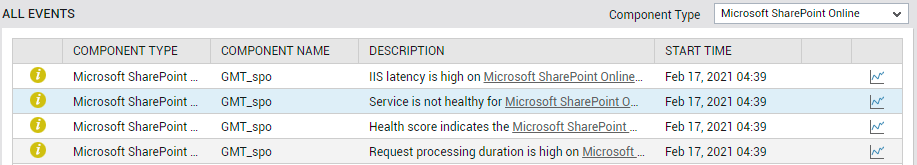
Figure 3 : The ALL EVENTS dashboard displaying open problems in the SharePoint Online environment
Use the Maintenance Events display here to know whether planned maintenance events have occurred.
eG Enterprise periodically emulates a user logging into SharePoint online to measure the logon performance. This page reports the results of the last emulation. From Login Statusin Figure 1, you can figure out if the simulated user login was successful - i.e., whether/not the user was able to login successfully. If so, you can use the Login Time displayed in Figure 1 to understand how long the simulated login took. Login failures and latencies in the login process can be detected, without waiting for real users to login, experience difficulties, and complain.
SharePoint Online includes a set of rules that you can run against a site collection to verify that it is working as expected. These rules are part of the site collection health checks. If any of these rules fail with errors, then the Health Check Errors measure in Figure 1 captures it promptly and reports it. You can click on the Health Check Errors count to know which health checks failed.
The current level of activity on the SharePoint Online service can be gauged using the Total Activities measure in Figure 1. Abnormal activity levels can be promptly detected, and measures initiated to manage them. To know what activities are performed, click on Total Activities. This will lead you to the USAGE page of the dashboard (see Figure 4), where you can analyze current and historical activity levels.
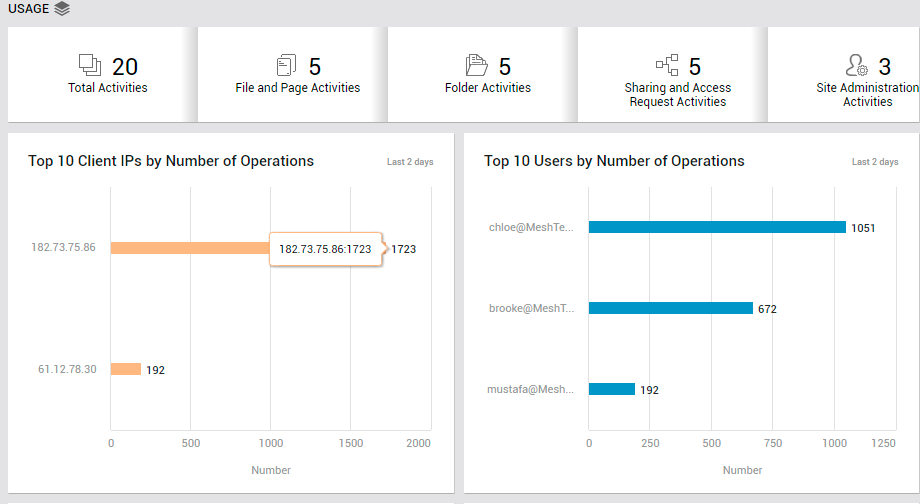
Figure 4 : The USAGE page that appears when the Total Activities counter in the OVERVIEW page is clicked
You can also ascertain the number of external users to SharePoint Online. If this number is unusually high, you may want to know which external users are accessing SharePoint Online, so you can confirm their authenticity. For this, click on the External Users count here (see Figure 1). Figure 5 will then appear.
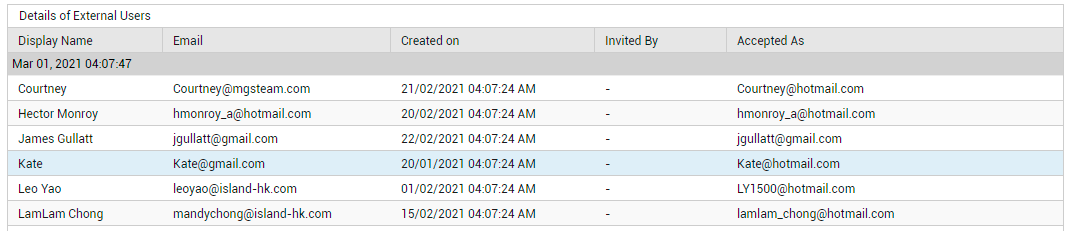
Figure 5 : Detailed diagnosis revealing external users
Next, use the File operations status section in Figure 1 to quickly analyze the different file operations that were performed and the time taken to perform each. Slow file operations and those that failed can thus be identified. You may want to investigate the slowness/failure, so as to improve user experience with SharePoint files.
To quickly spot the SharePoint sites that cannot be accessed via HTTP/S, take a quick look at the Site Availability section in the page (see Figure 6).
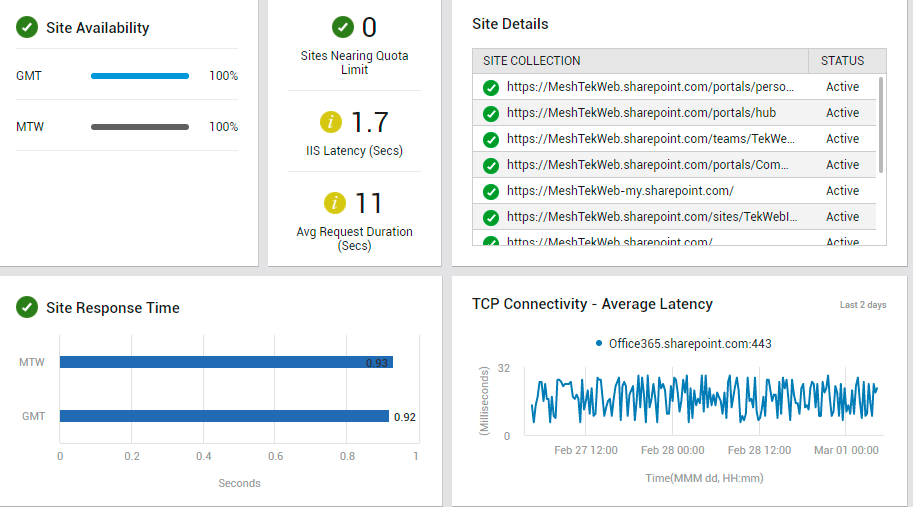
Figure 6 : The OVERVIEW page reporting site availability, responsiveness, site collection status, and latency in TCP connectivity
The responsiveness of these sites to web requests is also revealed; use the Site Response Time section for this purpose. Sites that are the least responsive can be quickly identified using this section.
If a SharePoint site runs out of storage site, files can no longer be stored on the site; nor can any file operations be performed on it, until more storage space is available. To prevent this, you need to closely monitor storage space usage by SharePoint sites, and identify those sites that are about to exhaust their storage quota. The Sites Nearing Quota Limit counter displayed in Figure 6 indicates whether/not there are any sites that are rapidly consuming their storage quota. Click on the counter to know which sites may potentially experience a storage crunch.
In addition, the Overview page reports the Avg Request Duration of SharePoint Online (see Figure 6). From this, administrators can figure out if SharePoint Online is servicing requests slowly. If such a processing delay is observed, then the page further reveals if IIS Latency - i.e., poor responsiveness of the IIS web server - is the reason for it.
A SharePoint Site Collection, just as the name implies, is a collection of SharePoint Sites. To identify the inactive site collections, refer to the Site Details table in this page (see Figure 6).
The page also provides a time-of-day TCP Connectivity - Average Latency graph (see Figure 6) using which you historically analyze the variations in TCP connection latencies to the SharePoint Online portal. This graph plots the latencies observed during the last 2 days, and points you to the exact date/time at which TCP connections to the portal were most sluggish.
Usage
The Usage page holds a mirror to the different types of operations that are performed on SharePoint Online, helps you isolate abnormal activity levels, and points you to the exact sites, users, and clients that are responsible for the abnormality.
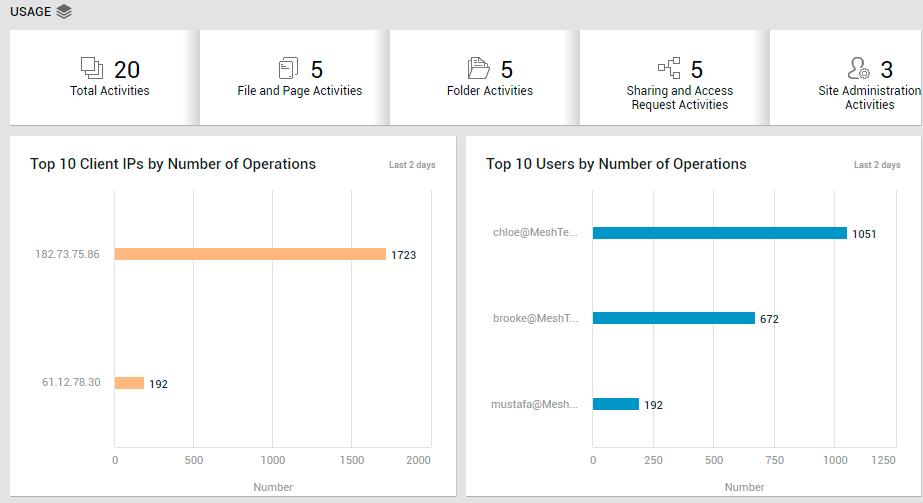
Figure 7 : The USAGE page of the SharePoint Online dashboard
To access the usage page, move your mouse pointer over the SharePoint Online icon in the left panel, and click on the Usage option within.
The Total Activities counter displayed in this page (see Figure 7) reports the total number of activities performed, and serves as a good indicator of the current operational load on SharePoint Online. If this number is abnormally high, then take a look at the File and Page Activities count, Folder Activities count, Sharing and Access Request Activities count, Site Administration Activities count, and the Synchronization Activities count displayed alongside. A quick look at the count of these activities will point you to the exact activity that caused the overall activity level to increase abnormally. If File and Page Activities are very high, then click on this count in the Usage page to know which users performed the maximum file and page activities and from which IP addresses (see Figure 8).

Figure 8 : Detailed diagnosis revealing which users performed the maximum number of file and page activities and from which IP address
Likewise, you can click on the Folder Activities count, Sharing and Access Request Activities count, Site Administration Activities count, or the Synchronization Activities count displayed in this page to know which users have performed the corresponding operation, how many times, and from which clients. In the process, you can identify user operations that are 'suspect' or questionable.
You can also click on the Total Activities counter. This will lead you to a series of measure graphs, each focusing on a different operation that is performed on files, folders, or sites (see Figure 9).
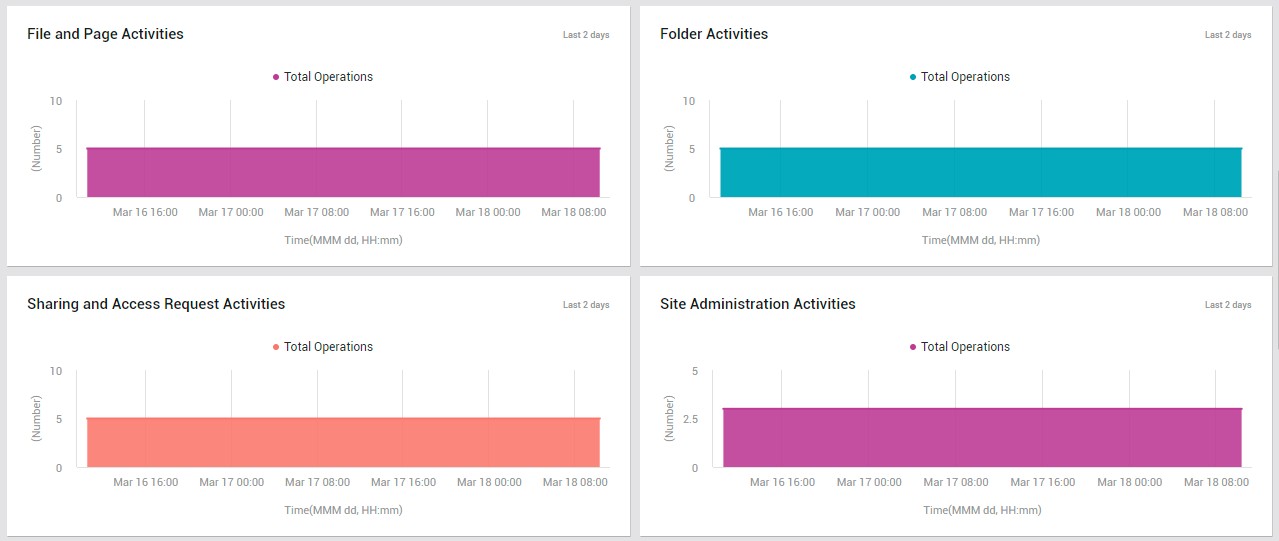
Figure 9 : Measure graphs on different activities performed on SharePoint Online
With the help of these graphs, you can observe changes in the number of activities (of each type) performed during the last 2 days. In the process, you can ascertain whether the unusual increase that you see in Total Activities is owing to a sudden surge in a specific activity's levels or is the climax of a consistent increase in that activity or more than one activity.
Sometimes, in the event of an unexpected spike in total activity levels, you may want to know which users and clients, across operation types, are contributing to the abnormal operational load. For this, all you need to do is take a quick look at the Top 10 Client IPs by Number of Operations and the Top 10 Users by Number of Operations bar graphs (see Figure 7). These bar graphs will point you to the exact client IP addresses and users that are responsible for the high levels of activity.
Next, let us focus on the Unique Users by Activity graph (see Figure 10).
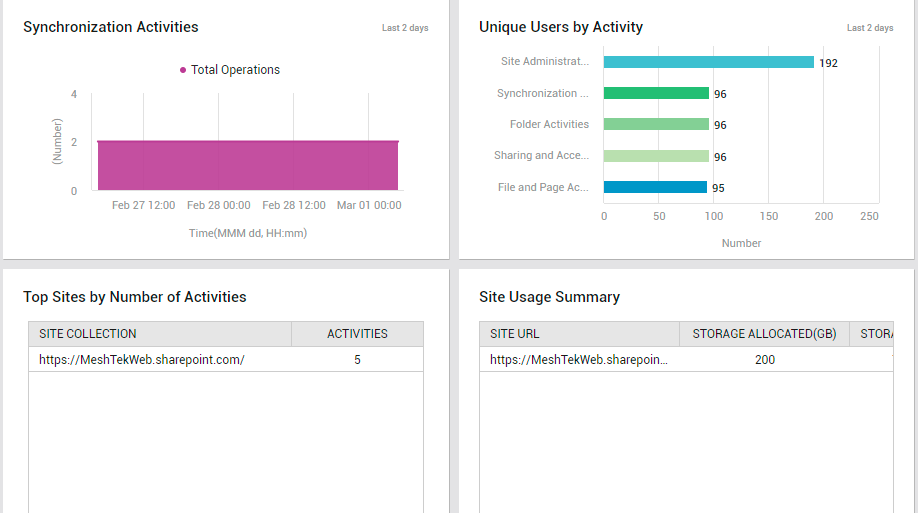
Figure 10 : The USAGE page reporting unique users by activity, top sites in terms of level of activity, and site storage usage summary
This graph will reveal the type of activity that has been performed by the maximum number and the least number of distinct users. The most and least popular activities can thus be identified. It will also point you to those activities with abnormal usage - i.e., activities that are performed by an unexpected number of users. You may want to investigate such activities to determine if there has been a security breach. For that, click on the bar representing the 'suspicious' activity type in the bar graph. This will tell you which users have performed what activities of that type. From this, you can confirm if the right users have performed the right activities.
The most active sites, in terms of the number of activities performed on them, are revealed by the Top Sites by Number of Activities table (see Figure 10). Sites experiencing dubious / questionable activity levels are also revealed in the process.
The Site Usage Summary table (see Figure 10) that appears next helps understand how each SharePoint site is using the storage resources allocated to it. With the help of this table, you can pinpoint those sites that are consuming storage resources excessively and hence, may soon run out of storage space. Such sites should either be allocated more storage resources or space should be cleared up in the sites for future usage.