Monitoring SilverStream Application Servers
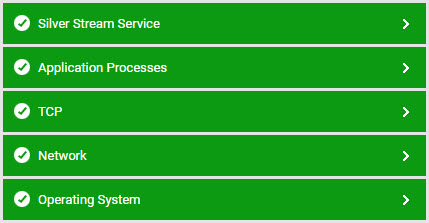
eG Enterprise provides a special SilverStream monitoring model (see Figure 1) to periodically monitor the helath of the Silverstream application server. The eG agents can track the availability, performance, and usage of SilverStream application servers. Critical information about the health of a SilverStream server such as the current load on the server, current sessions, percentage of thread pool utilization, processing time for requests, memory usage patterns, etc., can be obtained from the eG agents. Coupled with eG Enterprise's relative thresholding, single click diagnosis, historical trending, and integrated monitoring capabilities, this new enhancement offers a powerful, single stop monitoring solution for customers using SilverStream application servers.
The SilverStream server uses a SilverServer application process to start the server. The Processes test parameters for SilverStream servers should be configured to monitor this process. To obtain statistics specific to a SilverStream server, the eG Enterprise relies on the Client API provided by SilverStream server. SilverStream server can be configured to listen on three different ports – Runtime port, design port and Admin port. When the SilverStream server is first installed on a particular port number, all the three port numbers will have the same value. Through eG Enterprise's administrative interface, the Admin port number on which the SilverStream server listens must be specified. For the eG Enterprise to use the SilverStream Client API, the root path of the SilverStream installation must be specified through eG Enterprise's administrative interface. If SilverStream server is configured to authenticate users connecting to it, a valid username and password must be specified through eG Enterprise's administrative interface. While configuring the parameters for this test, the value corresponding to the ISAUTHENTICATED should be “Y”.

Figure 1 : Layer model for a SilverStream application server