Monitoring Snowflake
eG Enterprise offers a specialized monitoring model that monitors the Snowflake service using targeted queries and sheds light on current or probable performance dips that the service might suffer.
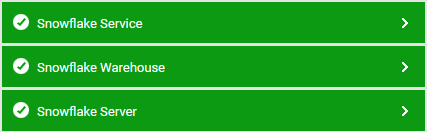
Figure 1 : Layer Model for Snowflake
Every layer of Figure 1 is mapped to a wide variety of tests that monitor critical performance parameters such as availability, workload, query execution performance of the core components of the service architecture. To pull out such useful performance data from the service, the eG agent uses JDBC and executes JDBC queries over Snowflake database.
The metrics so collected would enable administrators to find accurate answers for the following performance queries:
- What is the percentage availability of the service?
- What is the average time service takes to respond to a query?
- How much time on an average is taken for query execution on database?
- What is the percentage of failed user connections out of total connection requests?
- How is the performance of query executions, what is the number of failed queries?
- What is the maximum time for query execution?
- What is the maximum time for the blocked transaction to be unblocked?
- What is the status of each warehouse?
- What is the percentage of available warehouse resources and resourcing in provisioning?
- What is workload on given warehouse evidenced by queues query load and blocked queries?
- What is the number of scheduled task and how many out of them have failed?
- How efficiently the data load is working evidenced by percentage of failed loads out of total loads?
- Is the replication working optimally, what is amount of data replicated and how much is lag in replication process?