Monitoring Solace PubSub+ Event Broker
eG Enterprise offers an exclusive monitoring model (see ) for the Solace PubSub+ Event Broker, which performs top-down monitoring of the target broker, and proactively alerts administrators to unavailability, hardware abnormalities, irregularities, latencies and overall performance issues in the broker.
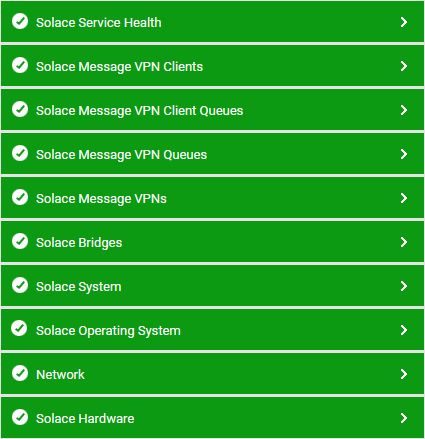
Figure 1 : The layer model of Solace PubSub+ Event Broker
Each layer of is mapped to tests that report on the health of the broker, the availability of the broker in the redundant setup, message VPN bridges, the message queues, VPNs, and client connections to the broker. Using the metrics reported by these tests, administrators can find quick and accurate answers to certain persistent performance queries, such as the following:
-
Is the target Solace PubSub+ Event Broker available and responsive?
-
Is there any bridge disabled/down?
-
Which type of bridge is being utilized the maximum / minimum - is it the local bridge? or the remote bridge?
-
Are the disk drives mounted on the mount points running out of space?
-
Are the fans associated with the fan sensors operating normally?
-
Is any interface on the target Solace PubSub+ Event Broker handling heavy traffic?
-
What is the current status of each voltage sensor on the target event broker?
-
Has any temperature sensor registered an abnormal temperature reading?
-
Which type of memory is being over-utilized - is it physical memory? or swap memory? or the memory allocated for Solace subscriptions?
-
Does disk / network / compute latency affect the health of the target event broker?
-
Which type of message discard is frequently noticed on the target event broker?
-
Which protocol/service was maximally used by the clients to connect to the target event broker - is it REST? or MQTT? or web service? or SMF?
-
Has any client discarded maximum number of incoming/outgoing messages?
-
Is any Message VPN down?
-
Which type of service was used by the clients to connect to each Message VPN - is it AMQP? or MQTT? or REST? or Web transport? or SMF?
-
Which message delivery mode is used by the target broker to send from/receive by maximum number of messages - is it direct? or persistent? or non-persistent?
-
Has any Message VPN discarded maximum number of incoming/outgoing messages?
-
What is the current status of target event broker in the redundancy setup?
-
How many transaction replication requests failed when the Message VPN was in standby mode?
-
Which Message VPN took maximum time to reconnect?
-
When exactly the role of the target event broker changed from primary virtual router to backup virtual router and vice versa?
-
Is message spool of the target event broker active/enabled?
-
Which module on the primary virtual router/backup virtual router that had faulted and was not ready - is it the messagespool? or ADB? or flash memory module? or power module? or the routing interface?
-
Is replication enabled on the target event broker?
-
Has any TCP queue discarded maximum number of messages?
-
Which queue was loaded with maximum number of messages?
-
Which queue is over/under utilized?