Monitoring Solaris Virtual Server
eG Enterprise prescribes a specialized Solaris Virtual server monitoring model (see Figure 1).
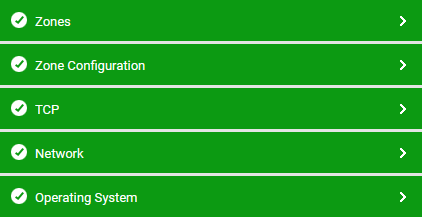
Figure 1 : The layer model of a Solaris virtual server
The statistics collected by the eG agent from each of the zones on the Solaris virtual server are then presented in the eG monitoring console using the monitoring model above. Every layer depicted by Figure 1 is associated with a wide variety of tests that measure the health of the Solaris host and each of the zones executing on it. The bottom three layers in Figure 81 represent the status of the base Solaris OS. The Operating System layer of the model above monitors the resource usage of the Solaris kernel – particularly with respect to CPU, memory, and disk resources. The Network layer monitors the network connectivity of the kernel, and the Tcp layer monitors TCP connections to and from the kernel. While the Zone Configuration layer in Figure 1 reveals the overall status of the zones that have been configured on the Solaris virtual server, the Zones layer reports the relative resource usage levels of every zone.
Since the Solaris virtual environment does not have a full blown OS for each zone, eG Enterprise does not represent two views for a zone (as is the case in a VMware virtual environment). The Zones layers represents the relative resource utilization levels across zones as seen by the base OS.
Using the metrics reported by eG Enterprise, administrators can find quick answers to the following questions:
- How many zones are running on each Solaris server, what is the IP address of each of the zones, and when was the zone powered on?
- Does the base operating system have sufficient memory available to support the zones that it is hosting?
- Are all the zones accessible over the network?
- What is the CPU utilization of the base operating system and which of the zones is taking up excessive CPU? Are any processes waiting for I/O utilizing excessive CPU at the host or zone-level?
- Is swap space usage optimal at the host and individual zone-level?
- Which application(s)/process running on each of the zones is taking up CPU, memory, and disk resources?
- Which are the directories to which a zone has full access? Is there sufficient disk space in each of these directories?
- Which of the zones is seeing the highest and lowest network traffic?
- Which is the busiest zone in terms of the number of TCP connections that it handles currently?
- Has any zone been running for a long time?
- What is the total uptime of the zones, and when was a zone booted up?