The Zones Layer
The Zones layer provides the host operating system’s view of the resource usage levels of each of the zones hosted on it. Using the information reported by this test, administrators can:
- Determine which of the zones is taking up more resources (CPU, memory, network, or disk) than the others. This information can help with load balancing or capacity planning. For example, if one of the zones is receiving a very high rate of requests compared to the others, this zone may be a candidate for migration to another host, so as to minimize the impact it has on the other zones on the host.
- Determine times when sudden or steady spikes in the physical resource utilization are caused by the zones
By default, clicking on the Zones layer invokes the Zone View depicted by Figure 4. Using this view, you can quickly determine the health of each of the zones (including global zones) configured on the monitored Solaris host.
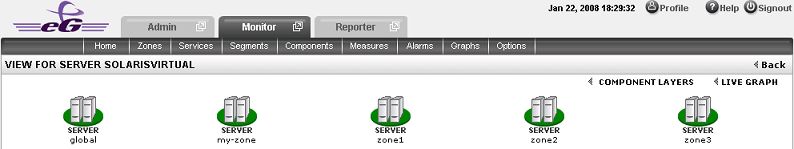
To zoom into the performance of a particular zone, click on any zone in Figure 4. This will lead you to Figure 5, which displays all the metrics that the eG agent collected from that zone. You are thus enabled to cross-correlate across the various metrics, and quickly detect the root-cause of current/probable disturbances to the internal health of a guest. To view the time-of-day variations in a measure, simply click on a measure in Figure 5.
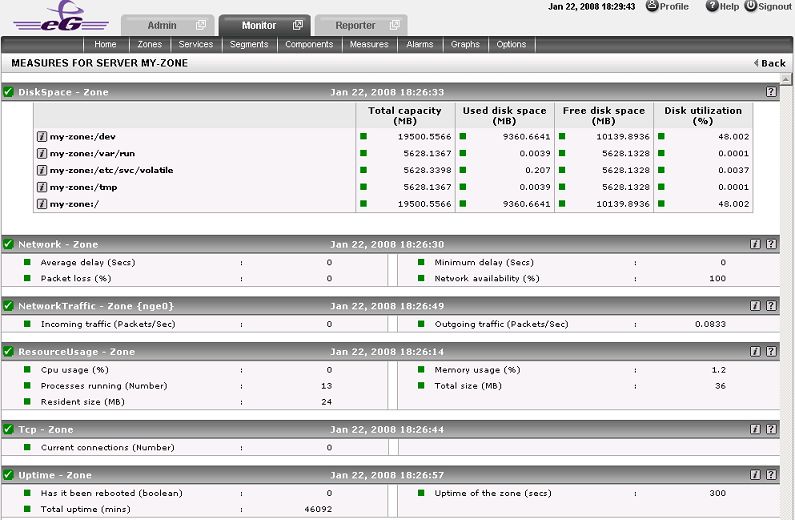
Figure 5 : The measures pertaining to a zone
To view real-time graphs of pre-configured measures (pertaining to the Solaris host and the zones operating on it), click on the live graph link in Figure 4. The graph display that appears subsequently (see Figure 6) has been organized in such a way that next to every host-pertinent measure graph, the closely related zone-specific measure graph appears. For instance, next to the graph of the 'Cpu usage' measure of the Resource – Zone test, you will find a graph of the ' CPU utilization’ measure of the Processor test. This way, you can easily compare and correlate how well the physical CPU resources are being utilized by both the Solaris kernel processes and those that are executing on the zones. On the basis of this analysis, you can proactively isolate potential performance issues, and also determine the root-cause of the issue - is it the host? or is it the zone? If you access this page from the LIVE GRAPH link in Figure 4, then, by default, you will view live graphs pertaining to the Solaris Virtual server. However, you can select a different virtualized component-type and a different virtualized component using the Component Type and Component lists (respectively) in Figure 6.
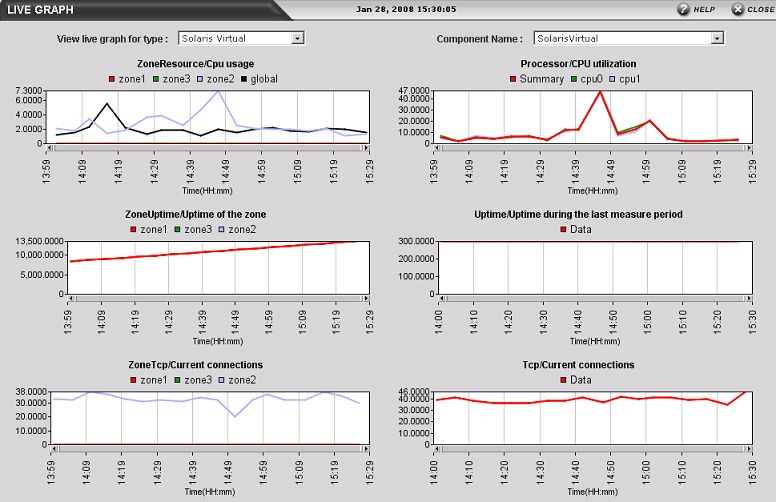
Figure 6 : Live graph of Solaris Virtual server
If you prefer to view the tests associated with the Zones layer instead of zone-specific measures or live graphs, then, simply click on the component layers link in Figure 4. This will lead you back to the layer model page, wherein you can view the complete list of tests associated with the Zones layer (see Figure 7).
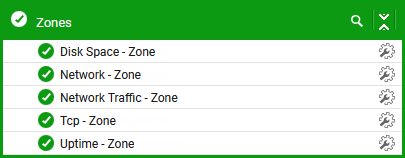
Figure 7 : The tests mapped to the Zones layer
Refer to the below links to know how to configure the tests and the metrics reported by each test;