Monitoring the Sybase ASE Server Using the MDA Tables
Starting Sybase ASE 12.5.3, users have the option of installing MDA tables on the Sybase server for accessing critical performance statistics pertaining to the server. If MDA tables are installed on a Sybase ASE server, then, you can use the Sybase ASE monitoring model (see Figure 1) offered by eG Enterprise to monitor that Sybase server.
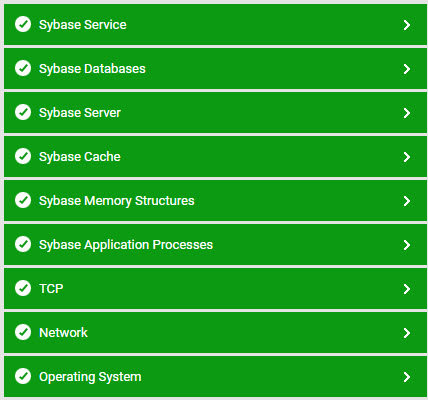
Figure 1 : The Sybase ASE monitoring model
Once the pre-requisites are fulfilled, then the tests mapped to each layer of Figure 1 will periodically run queries on the MDA tables to report a wealth of performance information pertaining to the Sybase server. Using these metrics, administrators can find quick and easy answers to the following performance queries:
- Is the Sybase server available? If so, is it responding quickly to client requests?
- Has the error log captured any errors recently? If so, what are they?
- Did too many wait events occur on the Sybase server during the last measurement period?If so, what type of events are these? How long did these events wait?
- Did any deadlocks occur?
- Are too many locks being held? Which user and process initiated these locks?
- Have locks been held for an unusually long time?
- Are the data and procedure caches being used optimally?
- Have the caches been sized correctly?
- Is the server able to process I/O requests quickly, or are any bottlenecks visible?
- Is the Sybase engine using up CPU excessively?
- Is the traffic to and from the server high?
- Are there any sleeping, blocked, or infected processes on the server? If so, what are they?
- Is any database on the server using memory and space excessively? If so, which one is it?
- Have any queries been running on the server for a very long time? If so, what are the queries?
- How is the user load on the server?
- Have any users initiated sleeping or infected processes on the server? What are these processes?