Sybase Data Cache Test
Data caches in ASE hold the data, index, and log pages currently in use, as well as recently used pages in memory. These caches are critical in providing high levels of system performance as they effectively avoid expensive disk I/O. Inadequately sized data caches can increase the incidence of physical disk accesses, thereby affecting the performance of the Sybase server. Periodic monitoring of the usage of the data cache is essential to determine whether the cache needs to be resized or not.
This test auto-discovers the data caches on the Sybase server, and tracks the usage of each cache. Frequently used objects and objects that occupy the memory are listed in detailed diagnosis. For this test to work, make sure that the enable monitoring parameter is enabled.
Target of the test : A Sybase ASE server on which the MDA tables have been installed
Agent deploying the test : An internal agent
Outputs of the test : One set of results for every database being monitored
| Parameter | Description |
|---|---|
|
Test Period |
How often should the test be executed. |
|
Host |
Refers to the IP address of the Sybase ASE server. |
|
Port |
The port number at which the Sybase server listens to. |
|
User |
To enable this test to connect to the Sybase server and collect the required metrics, it is enough if you configure the test with the name of a Sybase user who has the “mon_role”. However, for best results, it is recommended that you configure all Sybase tests with the credentials of a Sybase user who has the “mon_role”, “sa_role’, and “sybase_ts_role”. |
|
Password |
The password corresponding to the above user |
|
Confirm Password |
Confirm the password by retyping it here. |
|
Detailed Diagnosis |
To make diagnosis more efficient and accurate, the eG Enterprise embeds an optional detailed diagnostic capability. With this capability, the eG agents can be configured to run detailed, more elaborate tests as and when specific problems are detected. To enable the detailed diagnosis capability of this test for a particular server, choose the On option. To disable the capability, click on the Off option. The option to selectively enable/disable the detailed diagnosis capability will be available only if the following conditions are fulfilled:
|
| Measurement | Description | Measurement Unit | Interpretation |
|---|---|---|---|
|
Data cache hit ratio |
The hit ratio of each data cache in the Sybase server. |
Pct |
If the value of this measure is low, it indicates that too many physical reads are occurring on the Sybase server. If the problem persists, it could result in a serious contention for disk resources, which in turn, can cause the performance of the Sybase server to significantly deteriorate. You might want to consider resizing the data cache to avoid this adversity. The detailed diagnosis for this measure provides a list of objects that occupy the memory in cache, so that we can easily identify the objects that are consuming too much memory, and accordingly initiate corrective actions.
|
|
Number of objects |
The number of objects in each cache. |
Number |
Use the detailed diagnosis of this measure to view the list of objects in cache; this reveals the objects that are frequently accessed by users. |
The detailed diagnosis of the Data cache hit ratio measure reveals the objects that are in cache and the memory space occupied by each object. This way, you can quickly identify which objects are occupying the maximum space in the cache, check whether these objects are been used frequently, and if not, remove the objects from the cache, so as to free space.
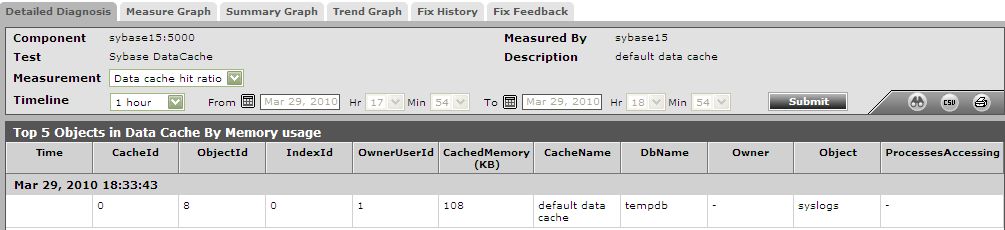
Figure 1 : The detailed diagnosis of the Data cache hit ratio