Sybase Statements Test
This test reports critical resource usage and general performance statistics related to transactions that are executed on the Sybase server. For execution, this test requires the enable monitoring, statement statistics active, per object statistics active, statement pipe max messages, and statement pipe active configuration parameters to be enabled.
Target of the test : A Sybase adaptive server (ver. 12.5 and above) on which MDA tables have been installed
Agent deploying the test : An internal agent
Outputs of the test : One set of results for every database being monitored
|
| Measurement | Description | Measurement Unit | Interpretation |
|---|---|---|---|
|
Avg CPU time: |
The average cpu time consumed by the transactions to this database. |
MillSec |
Ideally, this value should be low. If the value is high, then use the detailed diagnosis of this measure to view the top transactions in terms of CPU consumption. Such transactions can then be fine-tuned, so that they are more resource-efficient. |
|
Max CPU time: |
The maximum CPU time of transactions to this database. |
MillSec |
|
|
Avg logical reads: |
The average number of logical reads performed by the transactions to this database. |
Number |
Use the detailed diagnosis of this measure to view the complete details of transactions causing logical reads to occur on the database. |
|
Max logical reads: |
The maximum number of logical reads performed by transactions to this databases |
Number |
|
|
Avg physical reads: |
The average number of physical reads performed by transactions to this database. |
Number |
Physical database reads can cause processing overheads to escalate, thereby affecting database performance. These transactions therefore have to be minimized. If the value of this measure is very high, then use the detailed diagnosis of this measure to view the details of the transactions that are causing physical reads to occur. |
|
Max physical reads: |
The maximum number of physical reads performed by transactions to this database. |
Number |
|
|
Avg page modified: |
The average number of pages modified by transactions to this database. |
Number |
Use the detailed diagnosis of this measure to view the details of transactions that are modifying pages. |
|
Max Page modified: |
The maximum number pages modified by transactions to this database. |
Number |
|
|
Avg long waited: |
The average execution time of transactions that have taken too long to execute. |
Millsec |
If the value of this measure is high, it could indicate that one/more inefficient queries are executing on this database. You might then have to use the detailed diagnosis of the measure to view the top transactions in terms of execution time, and identify that transaction that has taken the longest to execute. Fine-tune the transaction to prevent database slowdowns.” |
|
Max long waited: |
The maximum number of times transactions waited in a database. |
MillSec |
|
|
Recently executed queries |
Indicates the number of queries recently executed on this database server. |
Number |
If the number of queries executed recently is very high, it might be a indication of high workload on database server. |
If the transactions to a database appear to be consuming too much CPU, then, you may want to identify the exact transaction that is utilizing the CPU resources excessively. For this purpose, you can use the detailed diagnosis of the Avg CPU time measure. This reveals the top 10 transactions in terms of their CPU usage, and thus enables administrators to isolate the most CPU-intensive transaction.
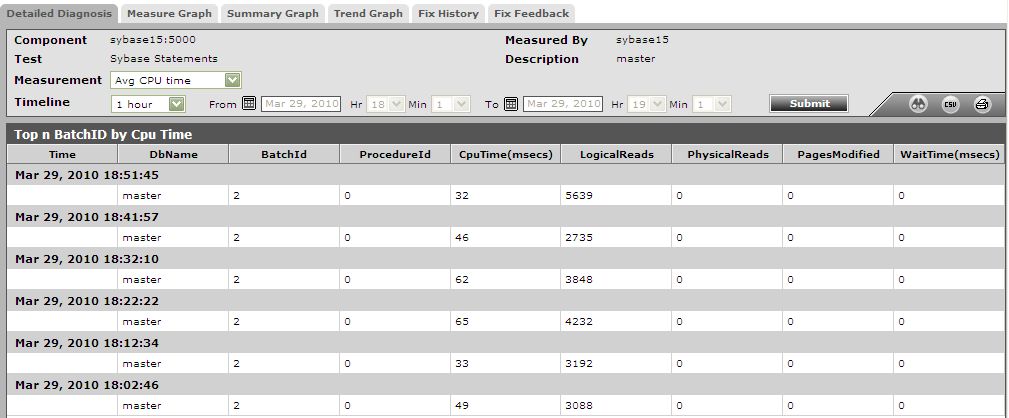
Figure 1 : The detailed diagnosis of the Avg CPU time measure
In the event of a sudden spike in the number of logical reads to a database, check the detailed diagnosis of the Avg logical reads measure to identify the transaction that is causing reads to rise.
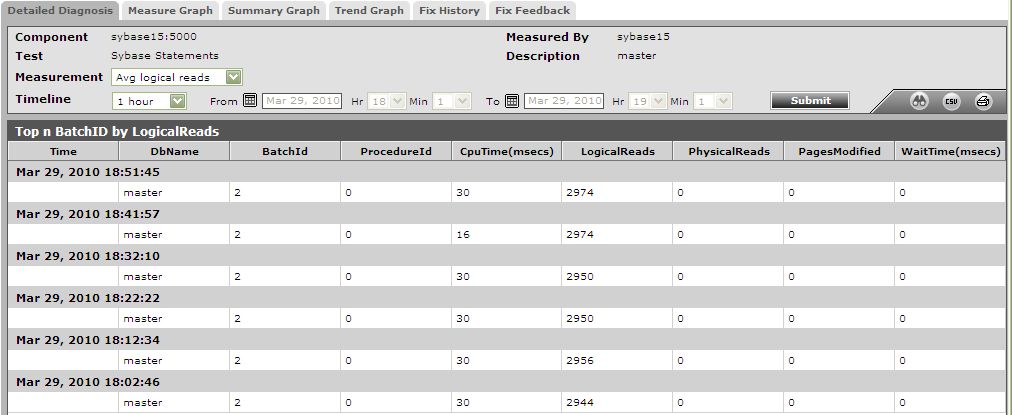
Figure 2 : The detailed diagnosis of the Avg logical reads measure