Viewing the Measures
To view the measures reported by the tests associated with the Emulated Client component, do the following:
- Login to the eG monitor interface.
-
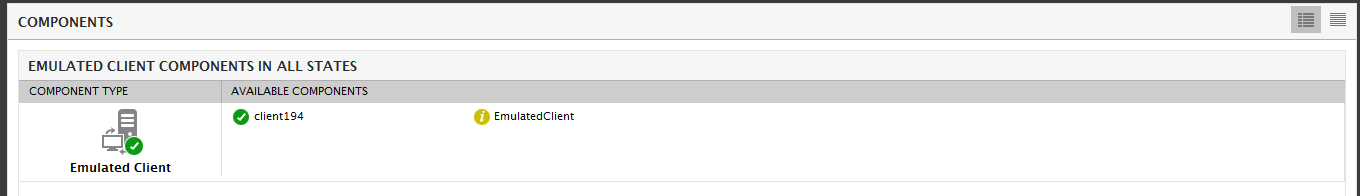
From the Hosts/Applications tile, select the Components option. Once the componentS page appears, select the Client Session Simulation option from the Type list therein, so as to view the current state of all components of type Client Session Simulation. Then, click the Submit button.
-
The component that we had configured previously will then be listed (see Figure 3). Click on the component to view the transactions that were simulated, and the health of each of these transactions (see Figure 4).

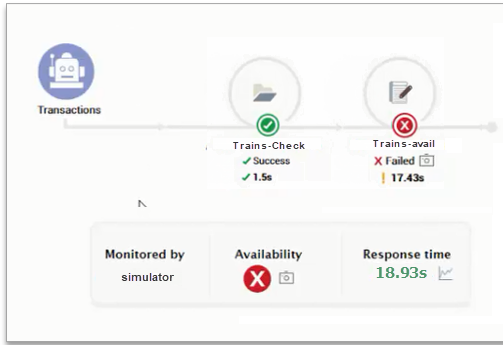
Figure 4 : Viewing the flow and health of the simulated transactions
-
Figure 4 reveals the transactions that were recorded for the eGTest script. When playing back the recorded script, the Client User Experience test captures the availability and responsiveness of each of the simulated transactions.
Measure Name Description Availability (%)
This relates to the availability of the page, i.e., whether a page has downloaded successfully or not. In Windows Applications, this relates to whether the step has executed properly or not. It is expressed in terms of percentage (%) – 100% if the download is a success and 0% if not. A variation of this is for the availability of all the steps in total - if even 1 step has failed, the total availability is 0 %.
Response time (Secs)
This relates to the time taken for the page to download or the step to execute. If the total availability is 0 % then the response time is set as ‘unknown’, else it is expressed in secs.
-
Additionally, Figure 4 also displays the overall availability and responsiveness of the Eurail web site. If each of the simulated transactions successfully complete, then the web site as a whole is deemed to be available. The response time of the web site is computed as the sum of the duration of the simulated transactions. The Response time of 6.09 seconds that you see in Figure 4 is this sum. It is the total time taken to access the Eurail website, request for High-speed train information, check for the trains available and receive a response from the web server.
-
Now, say the Trains-avail transaction in Figure 4 fails. Typically, if a single simulated transaction fails, the entire simulation too will stop at the point of failure - i.e., the simulation will not run any transaction beyond the failure. The transaction flow in this scenario will be as depicted by Figure 5.
-
Using Figure 5, enterprise IT can clearly pinpoint the precise step where the failure occurred. To instantly troubleshoot the failure, you can view the screenshot that eG automatically took of the application code, when the failure occurred. To invoke this error screenshot, click on the
 icon alongside the failed transaction in Figure 5. Figure 6 will then appear.
-
Besides the intuitive simulation flow depicted by Figure 4, the eG monitoring console also offers a layer model view for the Client Session Simulation component (see Figure 7).
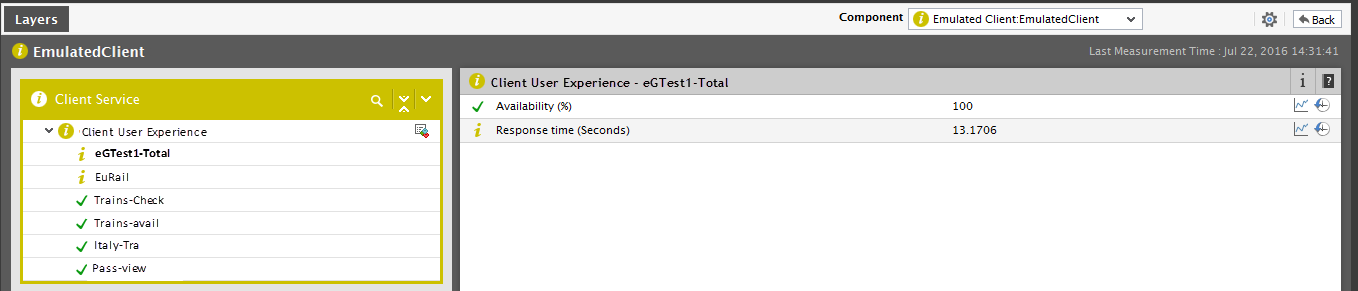
Figure 7 : Layer model of the Client Session Simulation component
-
Like Figure 4, the layer model also reports metrics for each transaction that is simulated. Additionally, metrics are reported for a 'Total' descriptor as well. These metrics are a good indicator of the overall availability and responsiveness of the Eurail web site in our example.