Enabling the Failed Request Log for IIS
Request-based tracing is available both in stand-alone IIS Servers and on Azure web apps and provides a way to determine what exactly is happening with your requests and why, provided that you can reproduce the problem that you are experiencing. Problems like poor performance on some requests, or authentication-related failures on other requests, or the server 500 error from ASP or ASP.NET can often be difficult to troubleshoot-unless you have captured the trace of the problem when it occurs.
To be able to capture and troubleshoot issues related to injecting the RUM script through the URL Rewrite module of IIS, you should have request-based tracing enabled. To achieve this, follow the broad steps below:
- After finishing the default installation of IIS 7, install the tracing role service.
- Enable failed request tracing at the site level, application level, or directory level.
- Configure failure definitions.
Each of these steps are detailed below.
Installing the Tracing Role service
To install the tracing role service on Windows server 2012 / 2012 R2, follow the steps below:
- On the taskbar, click Server Manager.
- In Server Manager, click the Manage menu, and then click Add Roles and Features.
- In the Add Roles and Features wizard, click Next. Select the installation type and click Next. Select the destination server and click Next.
-
On the Server Roles page, expand Web Server (IIS), expand Web Server, expand Health and Diagnostics, and then select Tracing. Click Next.
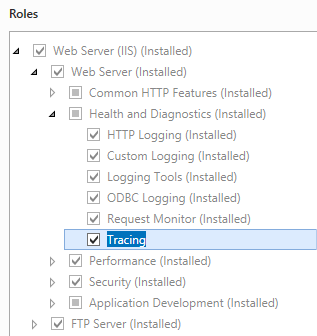
Figure 1 : Installing the tracing role service on Windows 2012
- On the Select features page, click Next.
- On the Confirm installation selections page, click Install.
- On the Results page, click Close.
To install the tracing role service on Windows 8 or 8.1, follow the steps below:
- On the Start screen, move the pointer all the way to the lower left corner, right-click the Start button, and then click Control Panel.
- In Control Panel, click Programs and Features, and then click Turn Windows features on or off.
-
Expand Internet Information Services, expand World Wide Web Services, expand Health and Diagnostics, and then select Tracing.
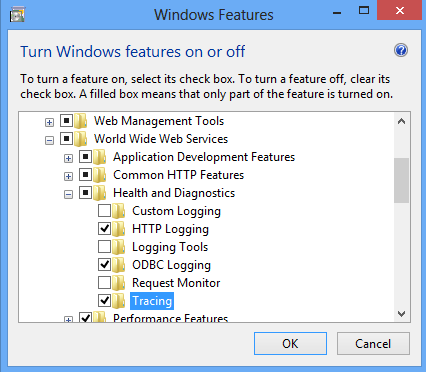
Figure 2 : Installing the tracing role service on Windows 8 or 8.1
- Click OK and then, click Close.
To install the tracing role service on Windows 2008 / 2008 R2, follow the steps below:
- On the taskbar, click Start, point to Administrative Tools, and then click Server Manager.
- In the Server Manager hierarchy pane, expand Roles, and then click Web Server (IIS).
- In the Web Server (IIS) pane, scroll to the Role Services section, and then click Add Role Services.
-
On the Select Role Services page of the Add Role Services Wizard, select Tracing, and then click Next.
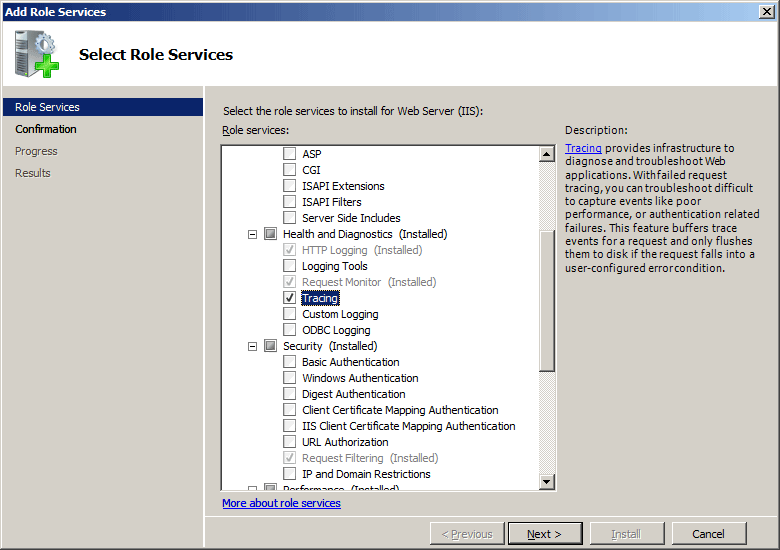
Figure 3 : Installing the tracing role service on Windows 2008/2008 R2
- On the Confirm Installation Selections page, click Install.
- On the Results page, click Close.
To install the tracing role service on Windows Vista or 7, follow the steps below:
- On the task bar, click Start, and then click Control Panel.
- In Control Panel, click Programs and Features, and then click Turn Windows features on or off.
-
Expand Internet Information Services, expand World Wide Web Services, expand Health and Diagnostics, and then select Tracing.
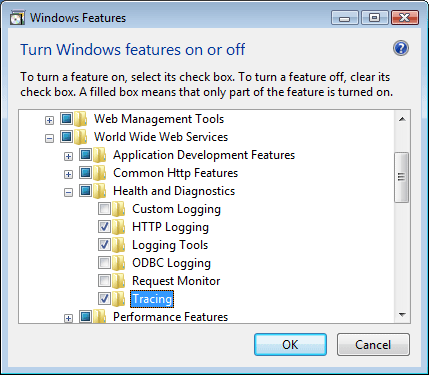
Figure 4 : Installing the tracing role service on Windows 7 or VIsta
-
Click OK.
Enabling tracing
-
Open Internet Information Services (IIS) Manager:
-
If you are using Windows Server 2012 or Windows Server 2012 R2:
- On the taskbar, click Server Manager, click Tools, and then click Internet Information Services (IIS) Manager.
-
If you are using Windows 8 or Windows 8.1:
- Hold down the Windows key, press the letter X, and then click Control Panel.
- Click Administrative Tools, and then double-click Internet Information Services (IIS) Manager.
-
If you are using Windows Server 2008 or Windows Server 2008 R2:
-
On the taskbar, click Start, point to Administrative Tools, and then click Internet Information Services (IIS) Manager.
-
-
If you are using Windows Vista or Windows 7:
- On the taskbar, click Start, and then click Control Panel.
- Double-click Administrative Tools, and then double-click Internet Information Services (IIS) Manager.
-
- In the Connections pane, select the server connection, site, application, or directory for which you want to configure failed request tracing.
-
In the Actions pane, click Failed Request Tracing...
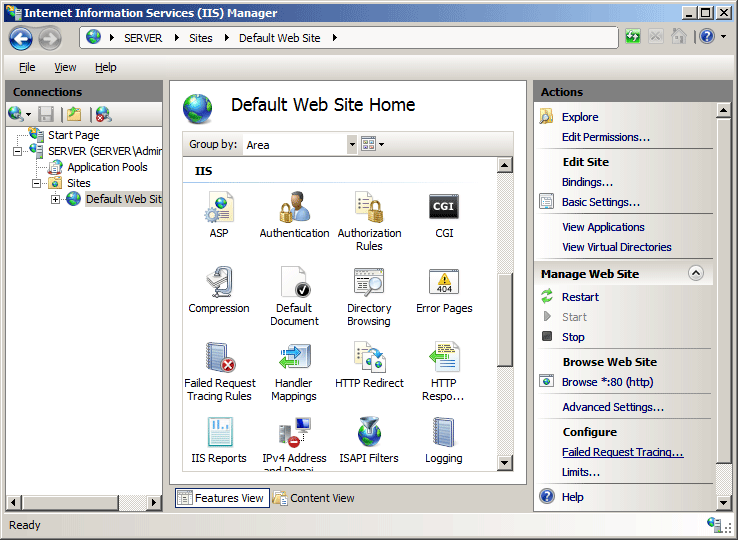
Figure 5 : Clicking Failed Request Tracing
-
In the Edit Web Site Failed Request Tracing Settings dialog box, select the Enable check box to enable tracing, leave the default value or type a new directory where you want to store failed request log files in the Directory box, type the number of failed request trace files you want to store in the Maximum number of trace files box, and then click OK.
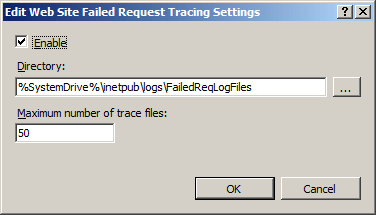
Figure 6 : Enabling tracing
Configuring failure definitions
-
Open Internet Information Services (IIS) Manager:
-
If you are using Windows Server 2012 or Windows Server 2012 R2:
- On the taskbar, click Server Manager, click Tools, and then click Internet Information Services (IIS) Manager.
-
If you are using Windows 8 or Windows 8.1:
- Hold down the Windows key, press the letter X, and then click Control Panel.
- Click Administrative Tools, and then double-click Internet Information Services (IIS) Manager.
-
If you are using Windows Server 2008 or Windows Server 2008 R2:
- On the taskbar, click Start, point to Administrative Tools, and then click Internet Information Services (IIS) Manager.
-
If you are using Windows Vista or Windows 7:
- On the taskbar, click Start, and then click Control Panel.
- Double-click Administrative Tools, and then double-click Internet Information Services (IIS) Manager.
-
- In the Connections pane, go to the connection, site, application, or directory for which you want to configure failed request tracing.
-
In the Home pane, double-click Failed Request Tracing Rules.
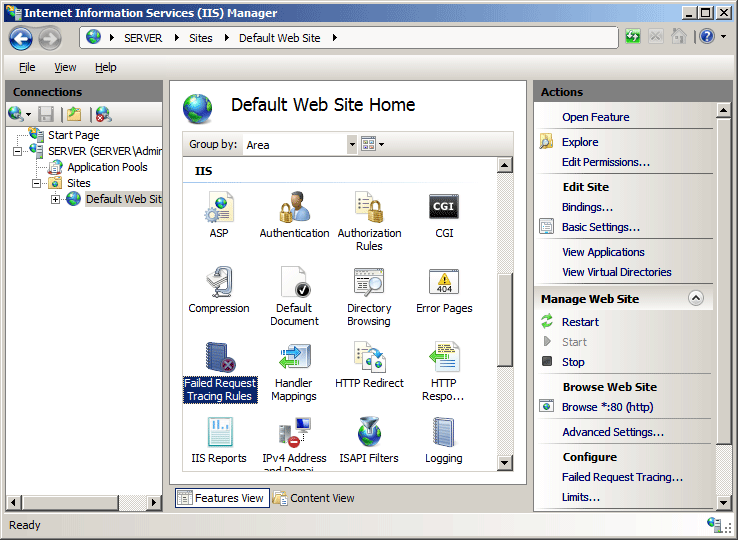
Figure 7 : Clicking Failed Request Tracing Rules
-
In the Actions pane, click Add. On the Specify Content to Trace page of the Add Failed Request Tracing Rule Wizard, select the content type you want to trace, and then click Next.
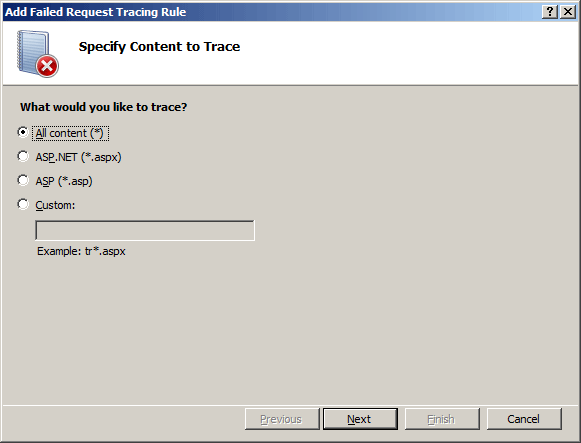
Figure 8 : Selecting the content type to trace
-
On the Define Trace Conditions page, select the conditions you want to trace, and then click Next. Trace conditions can include any combination of status codes, a time limit that a request should take, or the event severity. If you specify all conditions, the first condition that is met generates the failed request trace log file.
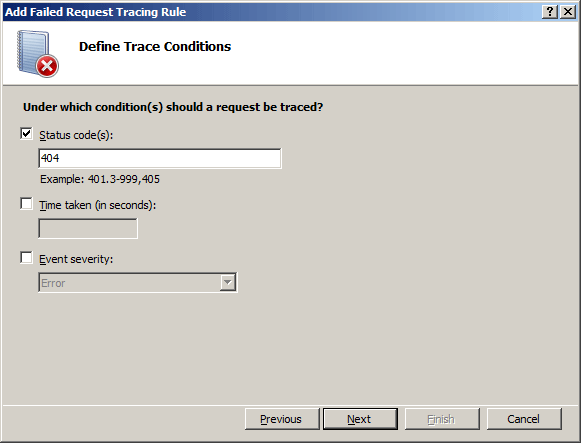
Figure 9 : Defining trace conditions
-
On the Select Trace Providers page, select one or more of the trace providers under Providers.
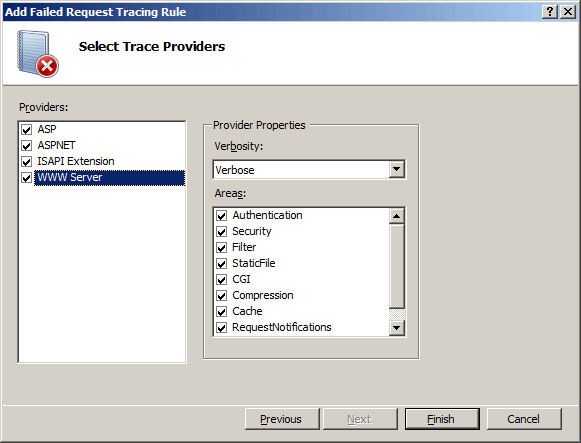
Figure 10 : Selecting one/more trace providers
-
On the Select Trace Providers page, select one or more of the verbosity levels under Verbosity.
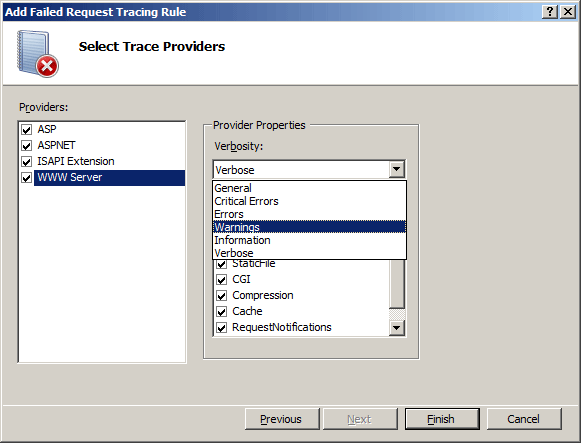
Figure 11 : Selecting one/more verbosity levels
- If you selected the ASPNET or WWW Server trace provider in step 8, select one or more functional areas for the provider to trace under Areas of the Select Trace Providers page.
- Click Finish.