Managing the Web Site/Web Application to be Monitored
Now that the required collectors have been installed and configured, let us now proceed to manage the web site/web application to be monitored and assign one of the configured collectors to it.
Note:
A collector that is not SSL-enabled cannot manage an SSL-enabled (i.e., an HTTPS) web site/web application. However, a collector that is SSL-enabled, can manage both HTTP and HTTPS web sites/web applications.
For this, follow the steps below:
- In the eG administrative interface, select the Add / Modify option from the Components menu in the Infrastructure tile.
-
Figure 1 will then appear.
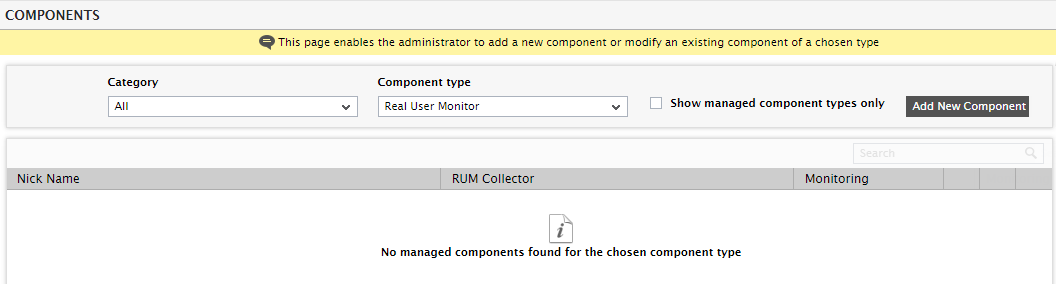
- Select Real User Monitor as the Component type from Figure 1 and click the Add New Component button to add a new component of that type.
-
When Figure 2 appears, provide a unique name for the web site/web application that you want to monitor in the Nick name text box.
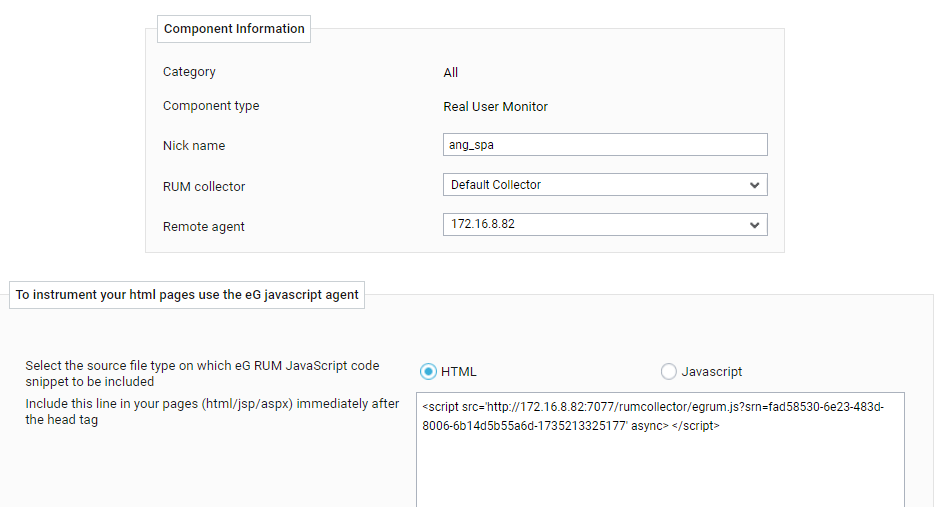
- Then, select the RUM collector you want to assign to the specified web site/web application. By default, the Nick Name (see Figure 2) of each of the RUM collectors that you have configured in your environment will populate the RUM collector drop-down in Figure 2. From this drop-down list, select the nick name of the RUM collector that you want to assign to the web site/web application being managed.
- Next, select the Remote agent that should monitor the web site/web application being managed by polling the selected collector.
-
Then, click the Add button in Figure 2 to add the Real User Monitor component. Doing so will invoke .
Figure 3 : Viewing the HTML code snippet to be injected into the monitored web pages
-
On the other hand, if you choose the Javascript option, then the text area below will automatically display the code snippet that should be included in the *.js files that you want to instrument.
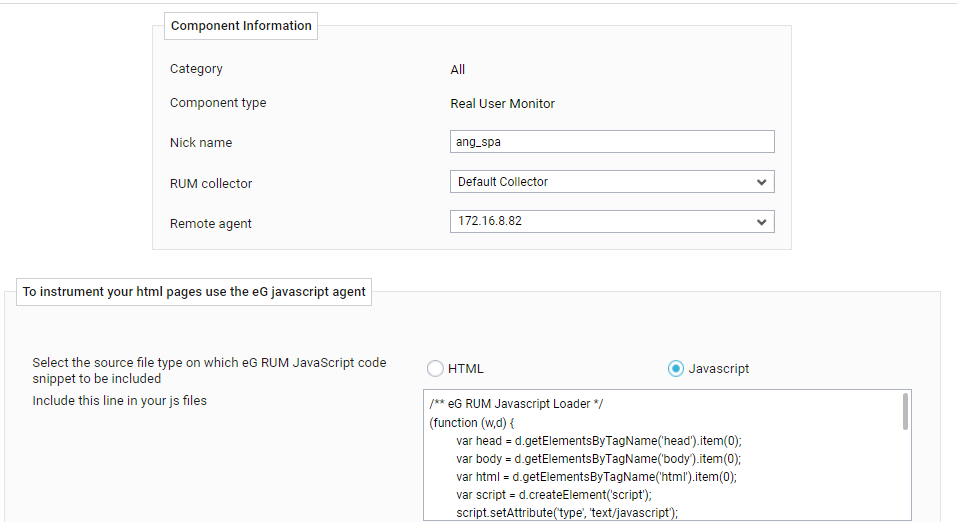
Figure 4 : Viewing the Javascript code snippet to be injected into the monitored web pages