Troubleshooting Failure of the eG RUM Tests
If all the eG RUM tests fail to report any metrics, you may want to do the following to determine the reason for the failure and to decide on a course of action:
- First, check whether the web site/web application being monitored is actively accessed by users. If traffic to a web site / web application is 0, then the eG tests will not report any metrics.
-
If the web site / web application is being actively used, then proceed to check whether/not the browser downloaded the JavaScript from the RUM collector. To verify that, do the following:
- First open the browser, and then, open the web page in which you have inserted the JavaScript.
-
Next, press F12 on your keyboard to open the Developer console. Figure 1 will appear.
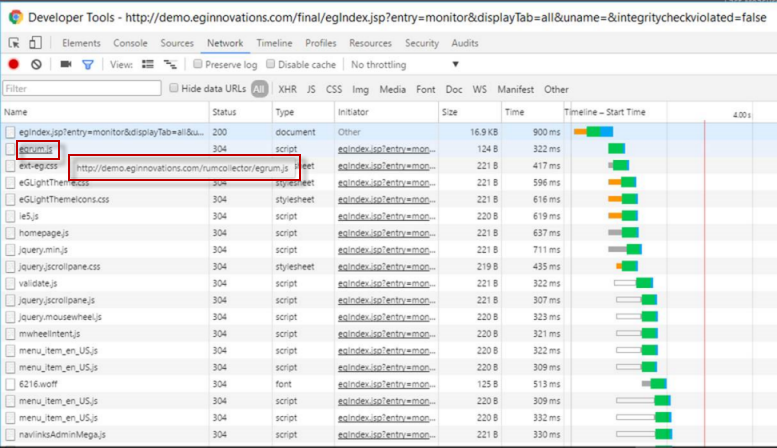
Figure 1 : Developer Tools console revealing whether/not the JavaScript is successfully inserted in a web page
- When Figure 1 appears, look for egrum.js in it. Once you find the entry, then check the status value that corresponds to that entry in the Status column of Figure 1. If the status value is 200 or 304, then its a clear indication that the browser has successfully downloaded the JavaScript from the RUM collector. If the status value is not 200 or 304, then it means that the browser was unable to download the JavaScript from the RUM collector. The reasons for the failure will vary according to the status value. For instance, the value 500 indicates that RUM collector was not running when the download was attempted. In such a case, starting the RUM collector can solve the problem.
- If the egrum.js listing is available in the Developer console, move your mouse pointer over that listing to know which RUM collector it was downloaded from. The URL that appears will be of the format: http://<IPAddress_or_Hostname_of_ RUMCollector> : <RUMCollectorPort> /rumcollector/egrum.js. Now, check whether the IP:Port in the URL is that of the RUM collector that you have configured for receiving beacons from this web site/web application. If so, it means that the egrum.js has been downloaded from the right RUM collector only.
-
Once you have confirmed that the JavaScript has been downloaded successfully from the correct RUM collector, then proceed.
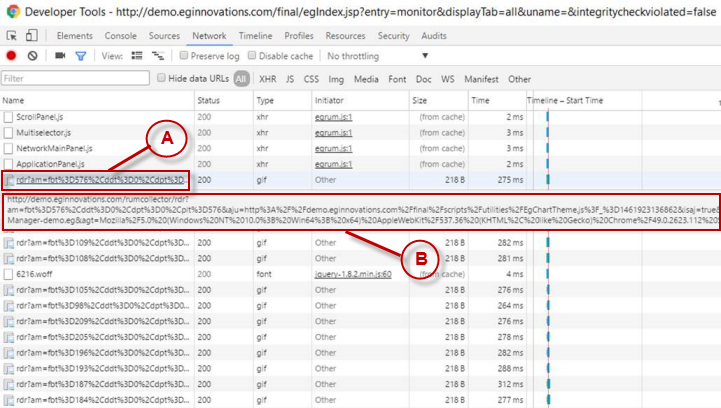
Figure 2 : Determining whether/not the browser is sending performance beacons to the RUM collector
When Figure 2 appears, do the following:
- Look for the entry indicated by 'A' in Figure 2. If the entry appears, it implies that the browser has attempted to send a beacon to the RUM collector.
- Then, check the value displayed in the Status column of entry 'A'. If the value is 200, it denotes that the beacon transmission was successful. Any other status value is indicative of a transmission failure. The real reason for the failure can be ascertained from the exact status value displayed. For instance, if the status value reported is 500, it means that the RUM collector was not running when the beacon was sent to it. In such a case, starting the RUM collector will solve the problem.
- If beacon transmission was successful, then move your mouse pointer over the entry 'A' in Figure 2. This will reveal the URL to which the beacon was sent. In the example of Figure 2, this is the URL that is indicated by 'B'. This URL will be of the format: http://<IPAddress_or_Hostname_of_RUMCollector>:<RUMCollectorPort>/rumcollector/<Details_contained_in_the_beacon>. To check whether the beacons were sent to the correct RUM collector, take a closer look at the <IPAddress_or_Hostname_of RUMCollector>:<RUMCollectorPort> in the URL. If this is that of the RUM collector that you have configured for receiving beacons from this web site/web application, then you can be rest assured that the beacons were sent to the right collector only.
- Now, if all the checks above are positive, you can be certain that the browser has sent the performance beacons to the collector. If this is the case, then proceed to check if the problem is at the RUM collector end - in other words, the collector may not have been able to write the beacons into its data folder. To verify that, do the following:
- Login to the RUM collector.
- If the RUM collector that is bundled with the eG manager is the one in use in your environment, then open the following folder on the collector host: <EG_RUM_COLLECTOR_INSTALL_DIR>\manager\tomcat\wenapps\WEB-INF\rum\data (on Windows; on Unix, this will be /opt/egurkha/manager/tomcat/webapps/WEB-INF/rum/data). If the RUM collector has been installed on a stand-alone host, then open the following folder on the host: <EG_RUM_COLLECTOR_INSTALL_DIR>\rum\tomcat\wenapps\WEB-INF\rum\data (on Windows; on Unix, this will be /opt/egurkha/rum/tomcat/webapps/WEB-INF/rum/data). Once you open the folder, refresh the folder to see if any new data files are created in the folder. If they are created, then it clearly indicates that the collector has received the beacons. On the other hand, if no new data files are created in the folder even after refreshing it, it could mean that the collector was not able to write the beacons into the data folder.
- To know what could have caused the write failure, use the beacon_receiver.log file in the <EG_RUM_DATA_COLLECTOR_INSTALL_DIR>\tomcat\webapps\rumcollector\web-inf\rum\logs directory (on Windows; on Unix, this will be the /opt/rum/tomcat/webapps/rumcollector/web-inf/rum/logs directory). This file logs all activities related to transmission of beacons to the RUM collector and the writing of metrics to flat files by the collector. To know how to configure this log, click on this link: Configuring Logging for the eG RUM Collector. You should be able to easily troubleshoot issues in beacon transmission and writing using this log file.
-
If flat files are created in the data folder, but the tests still fail, it only means that the eG agent running the tests was unable to read from the flat files. Errors in communication between the agent and the RUM collector could have lead to this problem. This issue could also occur if the agent stops running suddenly, or was not started at all. To determine why the agent failed to read from the files, use the rum.log file available in the <EG_AGENT_INSTALLlDIRr>\agent\logs directory (on Windows; on Unix, this will be the /opt/egurkha/agent/logs directory). All activities related to the eG agent communication with the eG RUM collector are tracked by this log. To know how to configure this log, click on this link: Configuring Logging for the eG Agent Communicating with the eG RUM Collector. You should be able to easily troubleshoot issues in agent-collector communication using this log file.