ABAP Dumps Report
In any environment, one of the reasons for performance degradation of the servers is errors encountered by the servers. These errors when left unnoticed may even collapse the entire environment. Similarly, in SAP environments, when unhandled exceptions occur while an ABAP program is executed, an ABAP runtime error is triggered, and the execution of the program is terminated. The error encountered is then logged as a short dump in the Syslog file which can be further used for post-mortem analysis on how to rectify such errors. eG Enterprise monitors such errors or dumps encountered in the SAP ABAP Instance. The ABAP Dumps report offered by eG Enterprise provides information on top dumps by source, types of dumps encountered, top hosts encountering dumps and user accounts that are impacted. This report thus helps administrators in figuring out the users who are frequently impacted by the dumps and take remedial measures accordingly.
To generate this report, do the following:
- Follow the menu sequence: REPORTS BY FUNCTION -> Domain-specific Reports -> SAP -> ABAP Dumps.
-
Figure 1 then appears. In Figure 1, select a criteria for analysis from the Analyze By list box.
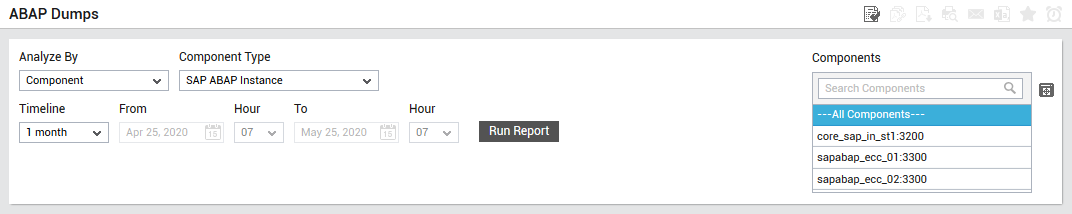
Figure 1 : Specifying the criteria for generating the ABAP Dumps report
-
Using this report, you can analyze the ABAP dumps encountered on one/more managed components, or those that are part of a zone, service or segment. The options provided by the Analyze By list box are discussed hereunder:
- Component: Select this option to choose the component(s) from across all the managed components in the environment.
- Zone: To generate a report for one/more components that are included in a zone, pick the Zone option. A Zone drop-down list will then appear, from which you would have to select the zone to which the components of interest to you belong. A Sub zone flag also appears. Indicate whether the components present within the sub-zones of the chosen zone are also to be to be considered for report generation, by setting the Sub zone flag to Yes.
- Segment: If you want to generate a report for one/more chosen components that belong to a segment, select the Segment option from Analyze By list box, and then pick the Segment from the drop-down list that appears.
- Service: If you want to generate a report for one/more components involved in the delivery of a service, select the Service option from Analyze By, and then pick the required Service from the drop-down list that appears.
- Choose a Component Type for which the report is to be generated.
- The Components list will now be populated with all the components that are managed in your environment for the chosen component type. If the Components list consists of too many components, then viewing all the components and selecting the ones you need for report generation could require endless scrolling. To avoid this, you can click the
 button next to the Components list. A Components pop up window will then appear using which you can view almost all the components in a single interface and Select the ones to be included in this report.
 -
Then, specify the Timeline for generating this report. You can either provide a fixed time line such as 1 hour, 2 days, etc., or select the Any option from the list to provide a From and To date/time for report generation.
Note:
For every user registered with the eG Enterprise system, the administrator can indicate the maximum timeline for which that user can generate a report. Once the maximum timeline is set for a user, then, whenever that user logs into eG Reporter and attempts to generate a report, the Timeline list box in the report page will display options according to the maximum timeline setting of that user. For instance, if a user can generate a report for a maximum period of 3 days only, then 3 days will be the highest option displayed in the Timeline list - i.e., 3 days will be the last option in the fixed Timeline list. Similarly, if the user chooses the Any option from the Timeline list and proceeds to provide a start date and end date for report generation using the From and To specifications, eG Enterprise will first check if the user's Timeline specification conforms to his/her maximum timeline setting. If not, report generation will fail. For instance, for a user who is allowed to generate reports spanning over a maximum period of 3 days only, the difference between the From and To dates should never be over 3 days. If it is, then, upon clicking the Run Report button a message box will appear, prompting the user to change the From and To specification.
-
In addition to the settings discussed above, this report comes with a set of default specifications. These settings are hidden by default. If you do not want to disturb these default settings, then you can proceed to generate the report by clicking the Run Report button soon after you pick one/more components for report generation. However, if you want to view and then alter these settings (if required), click on the
 icon. The default settings will then appear in the MORE OPTIONS drop down window (see Figure 2). The steps below discuss each of these settings and how they can be customized.
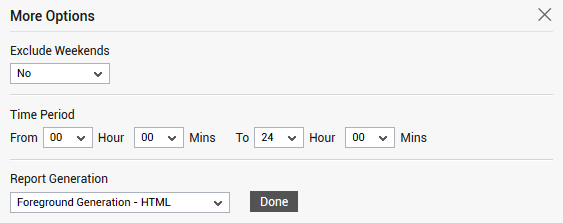
-
If the timeline specified for the report needs to exclude the data collected during the Weekends, then set Exclude weekends to Yes. If not, select No.
Note:
By default, the weekend constitutes Saturday and Sunday. To override this default setting, do the following:
- Edit the eg_report.ini file in the <EG_INSTALL_DIR>\manager\config directory.
- In the [EXCLUDE_WEEKEND] section of the file, the Days parameter is set to Saturday,Sunday by default. You can modify this by setting the Days parameter to a comma-separated list of other days of the week - say Friday,Saturday.
- Save the file after making the required changes.
-
Next, indicate the report Time period.
Note:
By default, the Time period is set to 24 hours. Accordingly, the From and To parameters in the [timeframe] section of the eg_report.ini file (in the <eg_install_dir>\manager\config directory) are set to 00:00 and 24:00 respectively. If need be, you can override this default setting by configuring a different timeframe against the From and/or To parameters.
-
In large environments, reports generated using months of data can take a long time to complete. Administrators now have the option of generating reports on-line or in the background. When a report is scheduled for background generation, administrators can proceed with their other monitoring, diagnosis, and reporting tasks, while the eG manager is processing the report. This saves the administrator valuable time. To schedule background processing of a report, you can either select the Background Save - PDF option from the Report Generation list. To process reports in the foreground, select the Foreground Generation - HTML option from this list.
Note:
- The Report Generation list will appear only if the EnableBackgroundReport flag in the [BACKGROUND_PROCESS] section of the eg_report.ini file (in the <EG_INSTALL_DIR>\manager\config directory) is set to Yes.
- The default selection in the Report Generation list will change according to the Timeline specified for the report. If the Timeline set is greater than or equal to the number of days specified against the MinDurationForReport parameter in the [BACKGROUND_PROCESS] section of the eg_report.ini file, then the default selection in the Report Generation list will be Background Save - PDF. On the other hand, if the Timeline set for the report is lesser than the value of the MinDurationForReport parameter, then the default selection in the Report Generation list will be Foreground. This is because, the MinDurationForReport setting governs when reports are to be processed in the background. By default, this parameter is set to 2 weeks - this indicates that by default, reports with a timeline of 2 weeks and above will be processed in the background.
- Click the Done button if any changes were made to the More Options drop down window.
- Finally, click the Run Report button to generate the report.
-
If the Report type is Foreground Generation - HTML, then Figure 3 will appear as soon as you click the Run Report button.
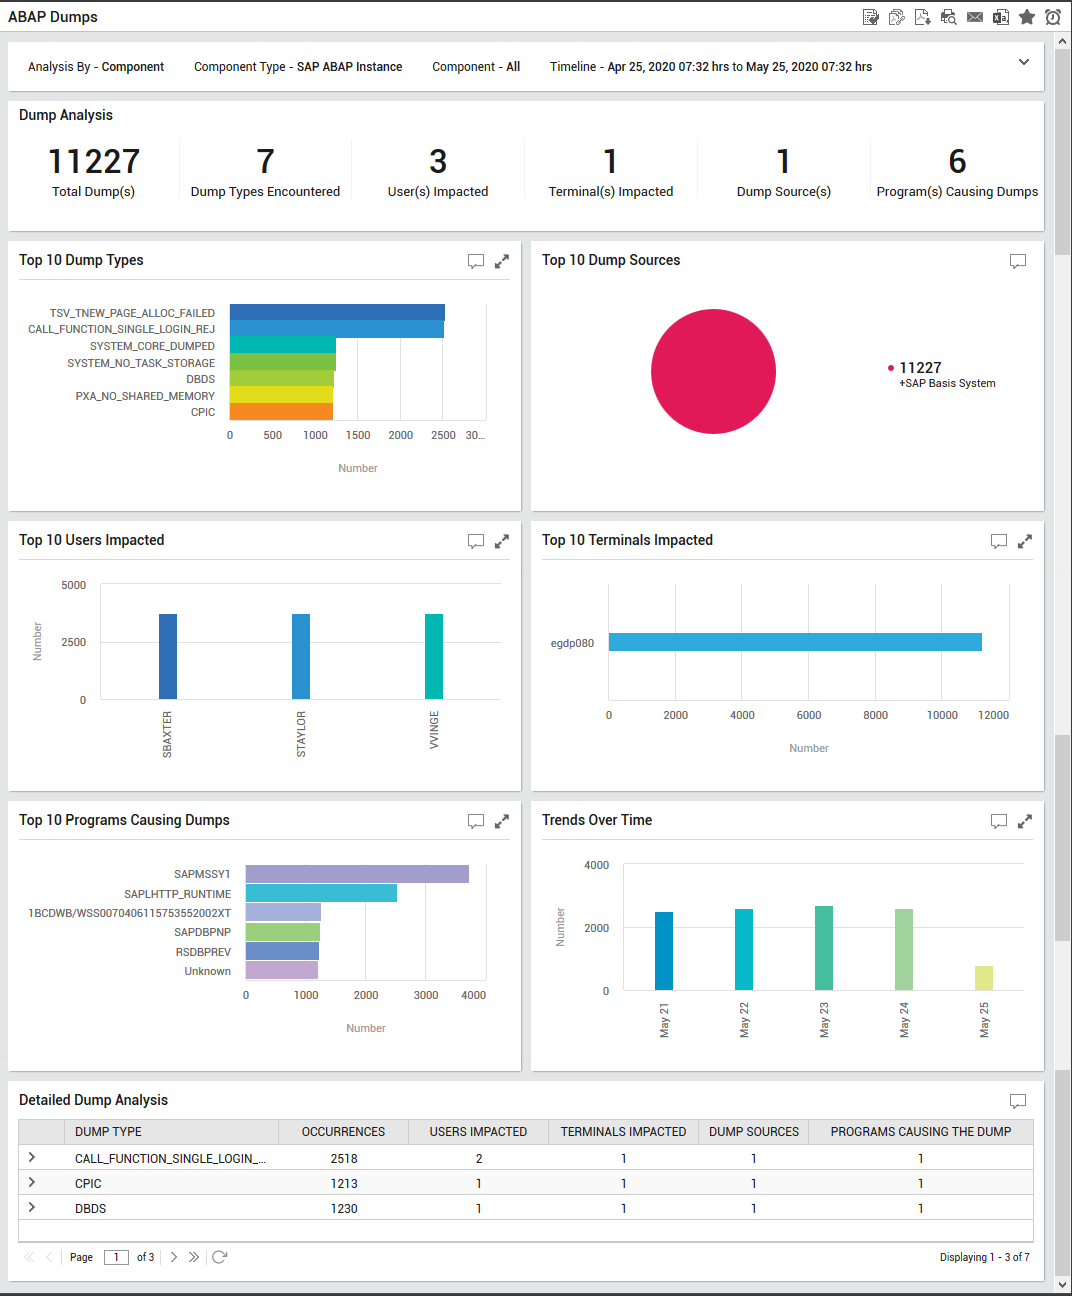
Figure 3 : The generated ABAP Dumps report
The generated report (see Figure 3) contains the following sections:
-
The Overview section provides an at-a-glance view on the count of dumps encountered in the chosen time period, the count of unique type of dumps encountered, the user accounts and terminals impacted due to dumps and the programs that caused dumps.
-
The next section is a series of graphs (bar graphs and pie charts) that throws light on the top 10 types of dumps encountered, sources, top 10 users impacted due to dumps, the top 10 terminals impacted due to dumps and the top 10 programs that caused the dumps over a chosen time period. Administrators can also figure out the exact date/time on which the systems encountered the maximum number of dumps and start investigating on the sudden increase in the count of dumps.
-
For each type of dump, the Detailed Dumps Analysis section reveals the count of dump occurrences, the count of users and terminals that were impacted, the source of the dump and the count of programs that caused dumps. Drilling down each type of dump will lead you to Figure 4.
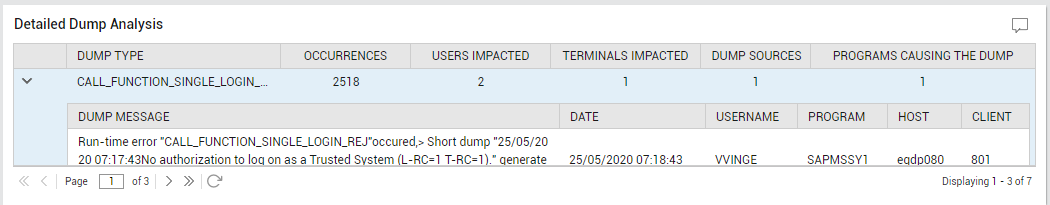
Figure 4 : Identifying the users impacted by the dumps
Figure 4 reveals the exact message that was recorded when the dump was encountered, the date and time on which the dump occurred, the user who was impacted, the exact program that caused the dump, the exact host and client that encountered the dump. Using this information, administrators can figure out the users who are frequently impacted by the dumps and take remedial measures accordingly.
-