Business Transaction Monitoring - Overview Report
Measuring business transaction performance in real-time and capturing transaction slowness instantly, is important. More important is to be wary of consistent transaction failures. Using this report, you can historically analyze the performance of individual business transactions to a web site / web application. In the process, you can quickly identify transactions that have been consistently slow or have encountered errors very often. Such transactions can then be marked for closer scrutiny.
To generate this report, do the following:
-
Follow the menu sequence: REPORTS BY FUNCTION -> Domain-specific Reports -> Web Application Monitoring -> Business Transaction Monitoring -> Overview. Figure 1 will then appear.
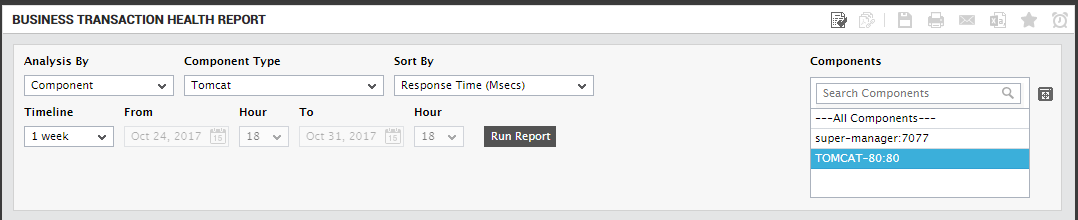
Figure 1 : Specifying the criteria for generating the Overview report
-
In Figure 1 that appears, select a criterion for analysis from the Analysis By list box. Using this report, you can analyze the business transactions performed on one/more components that are managed in your environment, or those that are part of a segment, service, or a zone. The options provided by the Analysis By list box are discussed hereunder:
- Component:Select this option to choose the component(s) from across all the managed components in the environment. For instance, for a report on the business transactions performed on all the managed Tomcat servers in the environment, select Tomcat from the Component Type list, select Component from the Analysis By list, and then select all the servers listed in the Components list. If the Components list consists of too many components, then viewing all the components and selecting the ones you need for report generation could require endless scrolling. To avoid this, you can click the
 button next to the Components list. The COMPONENTS pop up window will then appear using which you can view almost all the components in a single interface and Select the ones for which the report is to be generated. You can narrow your search further by using the Search text box. Specify the whole/part of the component name to search for in this text box, and click the
  icon next to it.
 - Service: Select this option if the components for which a report is to be generated are involved in the delivery of a business service. Then, select a Service.
- Segment: Choose this option if the virtual hosts to be evaluated are part of a segment. Then, pick a Segment for analysis.
- Zone: Pick this option for a report on the performance of virtual components that are included in a zone. Then, choose a Zone.
- Component:Select this option to choose the component(s) from across all the managed components in the environment. For instance, for a report on the business transactions performed on all the managed Tomcat servers in the environment, select Tomcat from the Component Type list, select Component from the Analysis By list, and then select all the servers listed in the Components list. If the Components list consists of too many components, then viewing all the components and selecting the ones you need for report generation could require endless scrolling. To avoid this, you can click the
- Next, select a parameter based on which the business transactions should be listed in the report from the Sort By list. For instance, if you wish to view the business transactions that are slow, then, choose the Slow option from this list. The report will then display the slowest business transactions on the top of the list followed by other transactions in descending order.
- By default, this report is generated for all business transactions. To this effect, All option is chosen from the Business Transactions list. Administrators can filter the business transactions based on their interest. For instance, if you wish to filter the transactions that end with .jsp, you can choose that EndsWith option from this list and type .jsp in the text box that appears near the list.
-
Then, specify the Timeline. You can either provide a fixed time line such as 1 hour, 2 days, etc., or select the Any option from the list to provide a From and To date/time for report generation.
Note:
For every user registered with the eG Enterprise system, the administrator can indicate the maximum timeline for which that user can generate a report. Once the maximum timeline is set for a user, then, whenever that user logs into eG Reporter and attempts to generate a report, the Timeline list box in the report page will display options according to the maximum timeline setting of that user. For instance, if a user can generate a report for a maximum period of 3 days only, then 3 days will be the highest option displayed in the Timeline list - i.e., 3 days will be the last option in the fixed Timeline list. Similarly, if the user chooses the Any option from the Timeline list and proceeds to provide a start date and end date for report generation using the From and To specifications, eG Enterprise will first check if the user's Timeline specification conforms to his/her maximum timeline setting. If not, report generation will fail. For instance, for a user who is allowed to generate reports spanning over a maximum period of 3 days only, the difference between the From and To dates should never be over 3 days. If it is, then, upon clicking the Run Report button a message box will appear, prompting the user to change the From and To specification.
-
In addition to the settings discussed above, this report comes with a set of default specifications. These settings are hidden by default. If you do not want to disturb these default settings, then you can proceed to generate the report by clicking the Run Report button. However, if you want to view and then alter these settings (if required), click on the
 icon. The default settings will then appear in the MORE OPTIONS drop down window (see Figure 2). The steps below discuss each of these settings and how they can be customized.
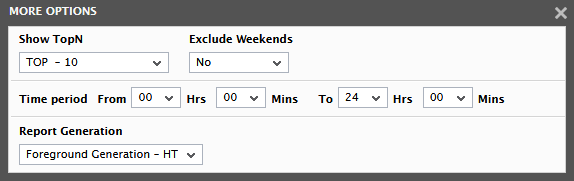
Figure 2 : The default settings for generating an Overview report
- By default, this report lists the performance of the Top 10 business transactions. If you wish to generate the report for the number of business transactions of your choice, then, you may do so by selecting an option from the Show TopN list box.
- Next, indicate the report Time period.
-
If the time period specified for the report needs to exclude the data collected during the weekends, then set Exclude weekends to Yes. If not, select No.
Note:
By default, the weekend constitutes Saturday and Sunday. To override this default setting, do the following:
- Edit the eg_report.ini file in the <EG_INSTALL_DIR>\manager\config directory.
- In the [EXCLUDE_WEEKEND] section of the file, the Days parameter is set to Saturday,Sunday by default. You can modify this by setting the Days parameter to a comma-separated list of other days of the week - say Friday,Saturday.
- Save the file after making the required changes.
-
In large environments, reports generated using months of data can take a long time to complete. Administrators now have the option of generating reports on-line or in the background. When a report is scheduled for background generation, administrators can proceed with their other monitoring, diagnosis, and reporting tasks, while the eG manager is processing the report. This saves the administrator valuable time. To schedule background processing of a report, select the Background Save - PDF option from the Report Generation list. To process reports in the foreground, select the Foreground Generation - HTML option from this list.
Note:
- The Report Generation list will appear only if the EnableBackgroundReport flag in the [BACKGROUND_PROCESS] section of the eg_report.ini file (in the <EG_INSTALL_DIR>\manager\config directory) is set to Yes.
- The default selection in the Report Generation list will change according to the Timeline specified for the report. If the Timeline set is greater than or equal to the number of days specified against the MinDurationForReport parameter in the [BACKGROUND_PROCESS] section of the eg_report.ini file, then the default selection in the Report Generation list will be Background Save - PDF. On the other hand, if the Timeline set for the report is lesser than the value of the MinDurationForReport parameter, then the default selection in the Report Generation list will be Foreground. This is because, the MinDurationForReport setting governs when reports are to be processed in the background. By default, this parameter is set to 2 weeks - this indicates that by default, reports with a timeline of 2 weeks and above will be processed in the background.
- Click the Done button if any changes were made to the More Options drop down window.
- Finally, click the Run Report button to generate the report.
-
If the Report type is Foreground Generation - HTML, then Figure 3 will appear as soon as you click the Run Report button.
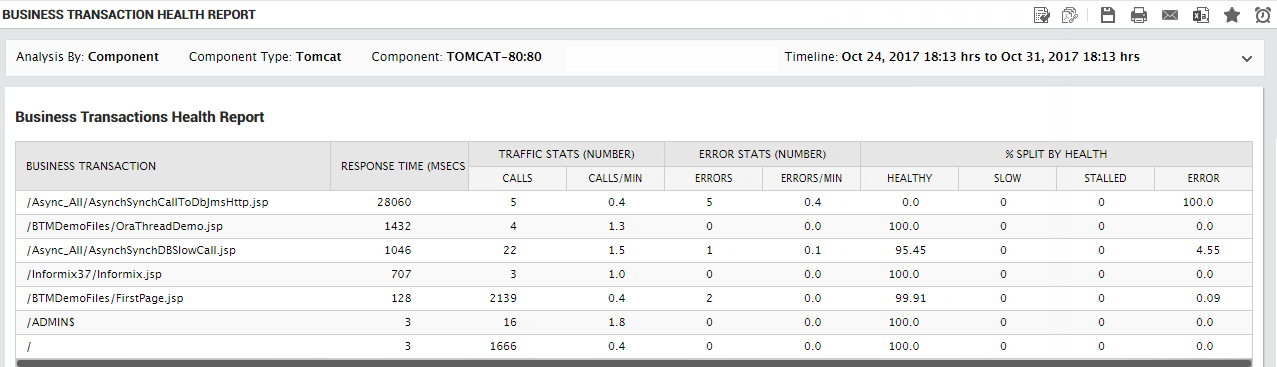
Figure 3 : The Business Transactions Monitoring - Overview Report
- Using the generated report (see Figure 3), you can easily identify the health/performance of the business transactions. For each business transaction to a web site/web application, the response time, the traffic statistics, the error statistics and the health are reported. Using these statistics, you can figure out the transactions that have been consistently slow or have encountered errors very often.