Capacity Prediction for Virtual Applications Report
Perform what-if analysis with Capacity Prediction for Virtual Applications report. Administrators can increase the user load on Citrix XenApp servers and they themselves can predict the resource utilization. Also, administrators can figure out how many more servers will be needed to support an increase in user workload. This report is more helpful in environments where administrators have to perform VDI roll outs, add more resources to their infrastructure, include an additional deployment for provisioning resources to new employees in the organization.
To generate this report, do the following:
- Follow the menu sequence: REPORTS BY FUNCTION -> Domain-specific Reports -> Virtual Applications / Desktops (Citrix XenApp / XenDesktop)
-
Figure 1 will then appear.
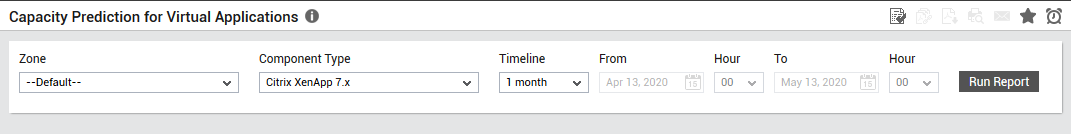
Figure 1 : Generating a Capacity Prediction for Virtual Applications report
-
In Figure 1, pick a Zone to analyze the capacity prediction of the virtual applications that belong to the zone.
- From the Component Type list, select the component type for which the capacity prediction report is to be generated.
-
Then, specify the Timeline for generating the report. You can either provide a fixed time line such as 1 hour, 2 days, etc., or select the Any option from the list to provide a From and To date/time for report generation. By default, the Timeline for generating this report is set to 1 month.
Note:
For every user registered with the eG Enterprise system, the administrator can indicate the maximum timeline for which that user can generate a report. Once the maximum timeline is set for a user, then, whenever that user logs into eG Reporter and attempts to generate a report, the Timeline list box in the report page will display options according to the maximum timeline setting of that user. For instance, if a user can generate a report for a maximum period of 3 days only, then 3 days will be the highest option displayed in the Timeline list - i.e., 3 days will be the last option in the fixed Timeline list. Similarly, if the user chooses the Any option from the Timeline list and proceeds to provide a start date and end date for report generation using the From and To specifications, eG Enterprise will first check if the user's Timeline specification conforms to his/her maximum timeline setting. If not, report generation will fail. For instance, for a user who is allowed to generate reports spanning over a maximum period of 3 days only, the difference between the From and To dates should never be over 3 days. If it is, then, upon clicking the Run Report button a message box will appear, prompting the user to change the From and To specification.
-
In addition to the settings discussed above, this report comes with a set of default specifications. These settings are hidden by default. If you do not want to disturb these default settings, then you can proceed to generate the report by clicking the Run Report button. However, if you want to view and then alter these settings (if required), click on the
 button. The default settings will then appear in the MORE OPTIONS drop don window (see Figure 2). The steps below discuss each of these settings and how they can be customized.
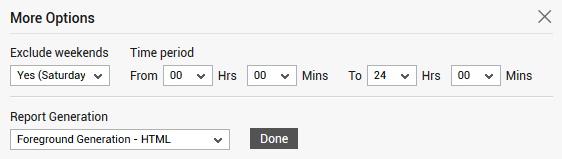
Figure 2 : The default settings for generating the Capacity Prediction for Virtual Applications report
-
If the timeline specified for the report needs to exclude the data collected during the Weekends, then set Exclude weekends to Yes. If not, select No.
Note:
By default, the weekend constitutes Saturday and Sunday. To override this default setting, do the following:
- Edit the eg_report.ini file in the <eg_install_dir>\manager\config directory.
- In the [virtual_cluster] section of the file, the EXCLUDE_WEEKEND parameter is set to Saturday,Sunday by default. You can modify this by setting the exclude_weekend parameter to a comma-separated list of other days of the week - say Friday,Saturday.
- Save the file after making the required changes.
- Next, indicate the report Timeperiod.
-
In large environments, reports generated using months of data can take a long time to complete. Administrators now have the option of generating reports on-line or in the background. When a report is scheduled for background generation, administrators can proceed with their other monitoring, diagnosis, and reporting tasks, while the eG manager is processing the report. This saves the administrator valuable time. To schedule background processing of a report, you can either select the Background Save - PDF option or the Background Save - CSV option from the Report Generation list. In this case, a Report Name text box will appear, where you would have to provide the name with which the report is to be saved in the background. To process reports in the foreground, select the Foreground Generation - HTML option from this list.
Note:
- The Report Generation list will appear only if the EnableBackgroundReport flag in the [BACKGROUND_PROCESS] section of the eg_report.ini file (in the {EG_INSTALL_DIR}\manager\config directory) is set to Yes.
- The default selection in the Report Generation list will change according to the Timeline specified for the report. If the Timeline set is greater than or equal to the number of days specified against the MinDurationForReport parameter in the [BACKGROUND_PROCESS] section of the eg_report.ini file, then the default selection in the Report Generation list will be Background Save - PDF. On the other hand, if the Timeline set for the report is lesser than the value of the MinDurationForReport parameter, then the default selection in the Report Generation list will be Foreground. This is because, the MinDurationForReport setting governs when reports are to be processed in the background. By default, this parameter is set to 2 weeks - this indicates that by default, reports with a timeline of 2 weeks and above will be processed in the background.
- Click the Done button if any changes were made to the More Options drop down window.
-
Finally, click the Run Report button. Figure 3 will then appear.
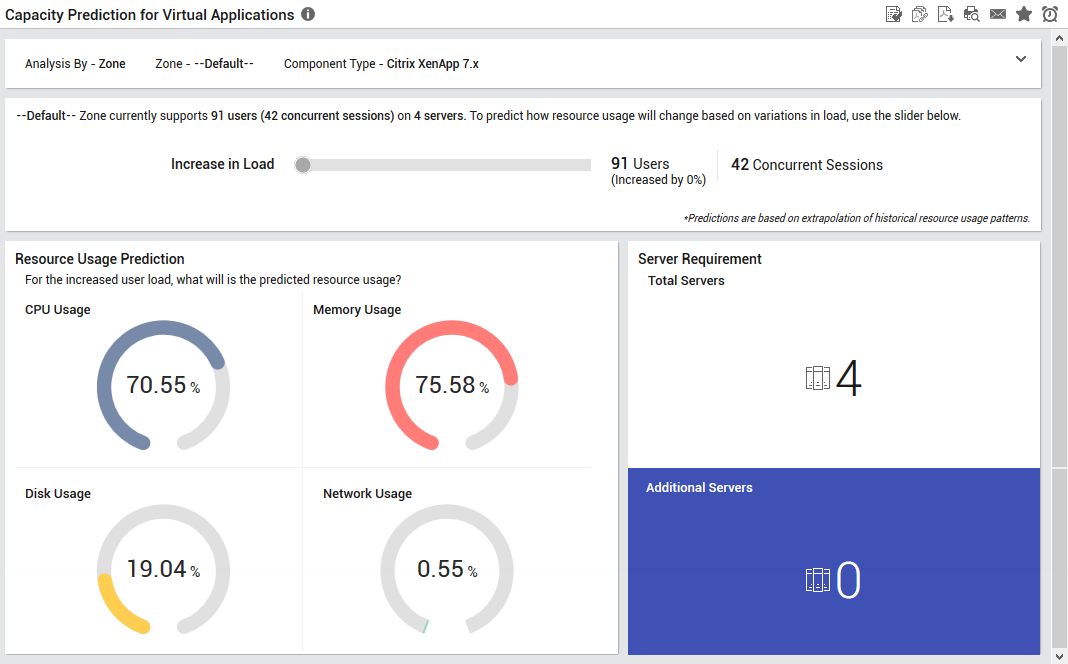
Figure 3 : The generated Capacity Prediction for Virtual Applications report
-
Using Figure 3, administrators can predict the resource utilization of the servers based on the user load. The graph shown in Figure 3 is the current resource utilization of the server - i.e., when there is no increase in the user load. To this effect, the Increase in Load slider will be set to off. Figure 3 will also report the current number of users and the concurrent sessions initiated by the users (alongside the slider) on the total number of servers available in the target environment.
The Resource Usage Prediction section comprises of CPU Usage, Memory Usage, Disk Usage and Network Usage doughnut charts that displays the current resource utilization of the servers.
The Server Requirement section reveals the total number of servers that are available in the target virtual environment. By default, the Additional Servers section will be listed as zero.
When you slide the Increase in Load slider (see Figure 4), based on certain historical resource usage patterns, eG Enterprise will predict the the future resource utilization based on the user load and will also reveal if additional servers are required to meet the increase in user load. Using this useful slider, administrators can themselves predict how many more servers will be needed to support an increase in user workload and can fine-tune their environment based on the given prediction.
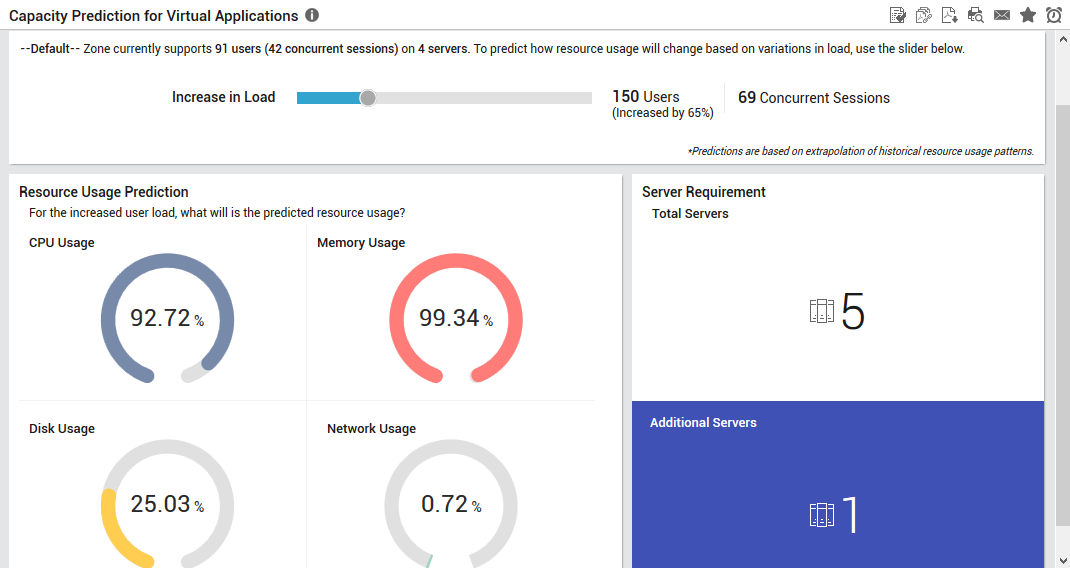
Figure 4 : Identifying the additional servers based on increased user load from the generated report
- On the other hand, if the Background Save - PDF option is chosen from the Report Generation list, then clicking on the Run Report button will not generate the report and display it in this page for your benefit. Instead, a message indicating that the report is being processed in the background will appear. This will be accompanied by a link that will lead you to the page that lists all the reports that are being processed in the background, and their current status. If background report generation fails for a report, you can regenerate that report using this page, or can even delete that report if need be. On the other hand, if background processing successfully completes for your report, then, you can view a PDF of the report by clicking on the
 icon in that page.