Citrix XenApp Overview Report
eG Enterprise includes 20+ key reports that every Citrix administrator needs. However, determining which report to use in what scenario can be a bit of a challenge for the admin and generating all the reports may be time consuming too. eG Enterprise now includes a Citrix XenApp Overview report that provides an at-a-glance preview of the key performance indicators for the target infrastructure. From a single report, you can see a consolidated view of user experience trends, session-level metrics, application usage data, events, server resource utilization, and license usage levels. All the charts shown in this report link to other reports available in eG Enterprise, so that you can drill down into individual reports for more granular data.
The report is generated by default, with a few pre-built selections and settings. Let us now deep dive into those pre-built selections and settings in the following steps:
- Select the Citrix XenApp Overview option by following the menu sequence: REPORTS BY FUNCTION -> Domain-specific Reports -> Virtual Applications / Desktops
-
By default, this report will be generated for the default zone with a time period of 1 week. This report comes with a set of default specifications. These settings are hidden by default. If you do not want to disturb these default settings, then you can proceed to view the generated report as soon as you select the Citrix XenApp Overview option from the menu sequence. However, if you want to view and then alter these settings (if required), click on the
 icon. The default settings will then appear in the MORE OPTIONS drop down window (see Figure 1). The steps below discuss each of these settings and how they can be customized.
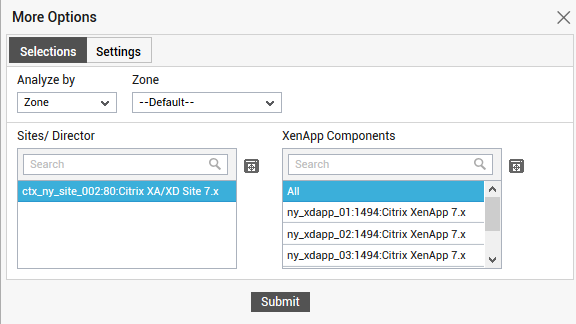
Figure 1 : The default selections using which the report was generated
-
By default, the Selections tab appears in the More Options window (see Figure 1). This report is generated for a Zone in the target environment, by default. To this effect the Zone option is chosen from the Analyze By list. Using this report, you can analyze the overview of one/more independent Citrix XenApp components, or those that are part of a segment, service, or a zone. This way, you can assess the impact of the virtual components of a particular service/segment/zone, and accordingly take decisions. The options provided by the Analyze By list box are discussed hereunder:
- Component: Select this option to choose the component(s) from across all the managed components in the environment.
- Service: Select this option if the components for which a report is to be generated are involved in the delivery of a business service. Then, select a Service.
- Segment: Choose this option if the virtual hosts to be evaluated are part of a segment. Then, pick a Segment for analysis.
- Zone: Pick this option for a report on the performance of virtual components that are included in a zone. Then, choose a Zone.
- By default, all the components belonging to the Citrix Site component types and Citrix XenDesktop Director component types are listed in the Sites/Director list. By default All option is chosen from this list. As soon as a single component listed in the Sites/Director list is chosen, the Components list is populated with all the Citrix XenApp servers provisioned through the chosen Citrix Site or Citrix Director. If the Sites/Director list consists of too many components, then viewing all the components and selecting the ones you need for report generation could require endless scrolling. To avoid this, you can click the
 button next to the Sites/Director list. The Sites/Director pop up window will then appear using which you can view almost all the components in a single interface and Select the ones for which the report is to be generated. You can narrow your search further by using the Search text box. Specify the whole/part of the component name to search for in this text box, and click the
  icon next to it.
 - By default, all the Citrix XenApp servers provisioned in the target environment is listed in the XenApp Components list. By default All option is chosen from this list. If the XenApp Components list consists of too many components, then viewing all the components and selecting the ones you need for report generation could require endless scrolling. To avoid this, you can click the button next to the XenApp Components list. The XenApp Components pop up window will then appear using which you can view almost all the components in a single interface and Select the ones for which the report is to be generated. You can narrow your search further by using the Search text box. Specify the whole/part of the component name to search for in this text box, and click the icon next to it.
-
A few additional settings are also provided by default in the Settings tab of the More Options drop down window (see Figure 2).
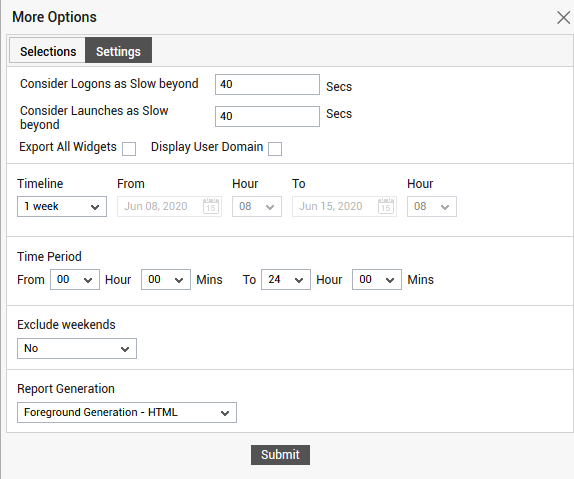
Figure 2 : The default Settings with which the report was generated
- By default, a user login is considered as slow if the user login process exceeds beyond 40 seconds. To this effect, 40 Secs is specified in the Consider Logons as Slow beyond text box. You can define your own value in seconds in this text box.
- By default, 40 seconds is specified in the Consider Launches as Slow beyond text box indicating that the applications that took more than 40 seconds to launch are deemed as slow. However, if you wish to alter the default specification, you can define your own value in this text box.
- eG Enterprise has an in-built capability to export the generated report as a PDF or CSV file, provided the generated report is the page that is viewed by the user. By default, this report consists of more than one tab page. To export the contents of all the tabs seamlessly, select the Export All Widgets check box. By default, this check box will be unchecked indicating that the current tab page that is viewed by the user alone will be exported.
- By default, a few graphs of this report will be generated for the users logging into the Citrix XenApp servers. Hoever, if a user logging into the Citrix XenApp server belongs to a domain, then, users can generate the report for each domain:user combination. Accordingly, users can check the Display Domain Name check box.
-
Then, specify the Timeline for generating this report. You can either provide a fixed time line such as 1 hour, 2 days, etc., or select the Any option from the list to provide a From and To date/time for report generation.
Note:
For every user registered with the eG Enterprise system, the administrator can indicate the maximum timeline for which that user can generate a report. Once the maximum timeline is set for a user, then, whenever that user logs into eG Reporter and attempts to generate a report, the Timeline list box in the report page will display options according to the maximum timeline setting of that user. For instance, if a user can generate a report for a maximum period of 3 days only, then 3 days will be the highest option displayed in the Timeline list - i.e., 3 days will be the last option in the fixed Timeline list. Similarly, if the user chooses the Any option from the Timeline list and proceeds to provide a start date and end date for report generation using the From and To specifications, eG Enterprise will first check if the user's Timeline specification conforms to his/her maximum timeline setting. If not, report generation will fail. For instance, for a user who is allowed to generate reports spanning over a maximum period of 3 days only, the difference between the From and To dates should never be over 3 days. If it is, then, upon clicking the Run Report button a message box will appear, prompting the user to change the From and To specification.
-
Next, indicate the report Time period.
Note:
By default, the Time period is set to 24 hours. Accordingly, the From and To parameters in the [timeframe] section of the eg_report.ini file (in the <eg_install_dir>\manager\config directory) are set to 00:00 and 24:00 respectively. If need be, you can override this default setting by configuring a different timeframe against the From and/or To parameters.
-
If the timeline specified for the report needs to exclude the data collected during the Weekends, then set Exclude weekends to Yes. If not, select No.
Note:
By default, the weekend constitutes Saturday and Sunday. To override this default setting, do the following:
- Edit the eg_report.ini file in the <EG_INSTALL_DIR>\manager\config directory.
- In the [EXCLUDE_WEEKEND] section of the file, the Days parameter is set to Saturday,Sunday by default. You can modify this by setting the Days parameter to a comma-separated list of other days of the week - say Friday,Saturday.
- Save the file after making the required changes.
-
In large environments, reports generated using months of data can take a long time to complete. Administrators now have the option of generating reports on-line or in the background. When a report is scheduled for background generation, administrators can proceed with their other monitoring, diagnosis, and reporting tasks, while the eG manager is processing the report. This saves the administrator valuable time. To schedule background processing of a report, you can either select the Background Save - PDF option or the Background Save - CSV option from the Report Generation list. In this case, a Report Name text box will appear, where you would have to provide the name with which the report is to be saved in the background. To process reports in the foreground, select the Foreground Generation - HTML option from this list.
Note:
- The Report Generation list will appear only if the EnableBackgroundReport flag in the [BACKGROUND_PROCESS] section of the eg_report.ini file (in the <EG_INSTALL_DIR>\manager\config directory) is set to Yes.
- The default selection in the Report Generation list will change according to the Timeline specified for the report. If the Timeline set is greater than or equal to the number of days specified against the MinDurationForReport parameter in the [BACKGROUND_PROCESS] section of the eg_report.ini file, then the default selection in the Report Generation list will be Background Save - PDF. On the other hand, if the Timeline set for the report is lesser than the value of the MinDurationForReport parameter, then the default selection in the Report Generation list will be Foreground. This is because, the MinDurationForReport setting governs when reports are to be processed in the background. By default, this parameter is set to 2 weeks - this indicates that by default, reports with a timeline of 2 weeks and above will be processed in the background.
- The generated report consists of a few tabs which offers in depth insights into the Citrix XenApp infrastructure. Let us now discuss the contents of each tab in detail in the following steps.
-
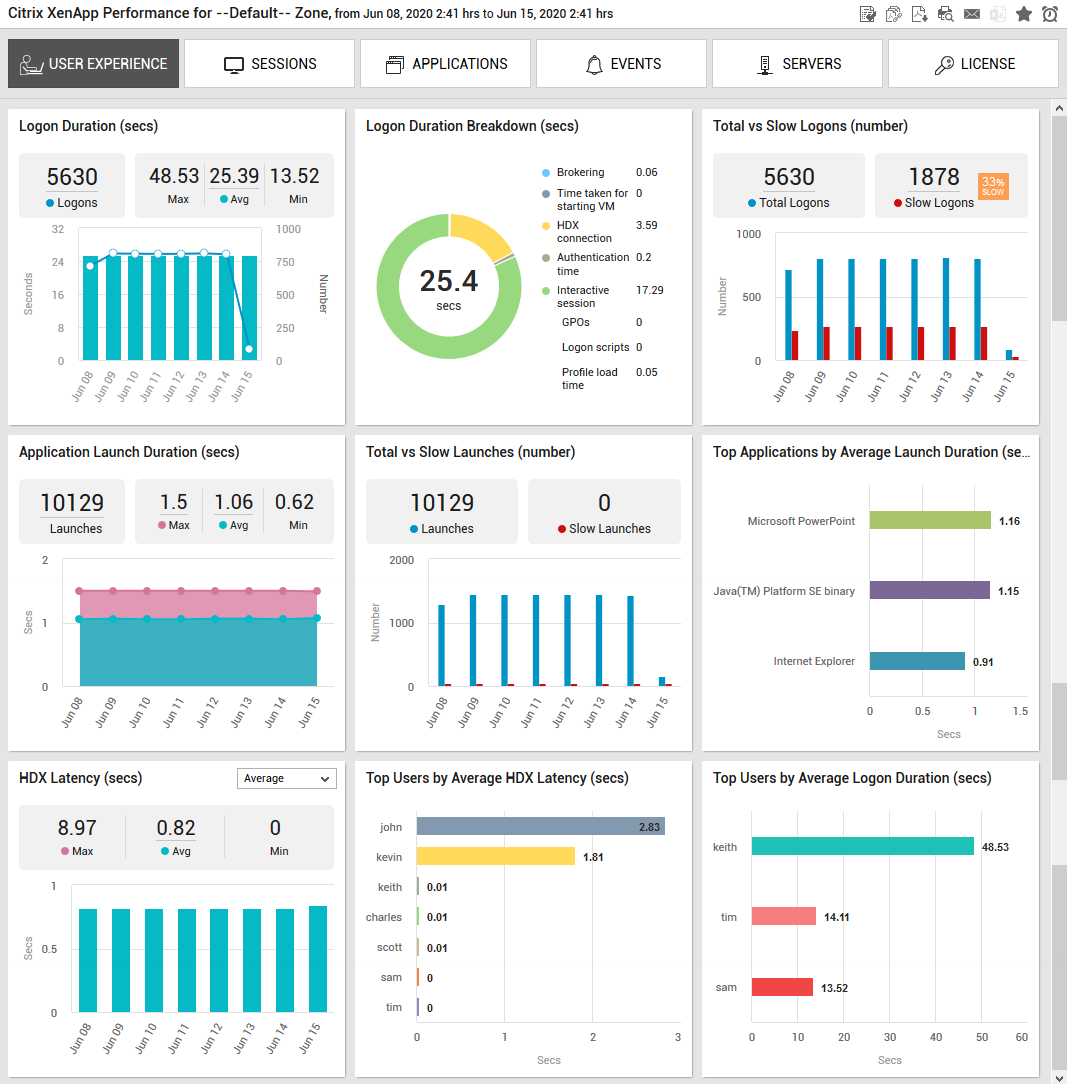
The USER EXPERIENCE tab (see Figure 3) reveals answers to the following questions of the administrators:
- When exactly did the logon duration time peak? What was the maximum number of logons registered on a chosen day?
- Where exactly did the logon take too long to complete? - is it the authentication time? or the profile load time? or the HDX connection time? or the time taken for starting the VM? or the logon scripts?
- How many slow logons were recorded against the total logons in the chosen time period?
- How long did it take to launch an application over a chosen period of time?
- How many application launches were recorded as slow against the total application launches over a period of time? When exactly were many applications slow to launch?
- Which applications were launched frequently and what is the average launch duration of each application?
- What is the average HDX latency noticed in the Citrix XenApp environment over a period of time and when did the HDX latency peaked?
- How many top users with average HDX latency and average logon duration were noticed in the Citrix XenApp environment over a period of time?
-
The SESSIONS tab as shown in Figure 4 helps administrators figure out answers to the following questions using a series of bar graphs :
- How many unique users logged in during the chosen time period and on which day were more users logged in?
- Which users utilized the maximum HDX bandwidth during the chosen time period?
- Which users utilized the maximum memory resources during the chosen time period?
- Which users utilized the maximum CPU resources during the chosen time period?
- How many concurrent sessions were initiated over a period of time?
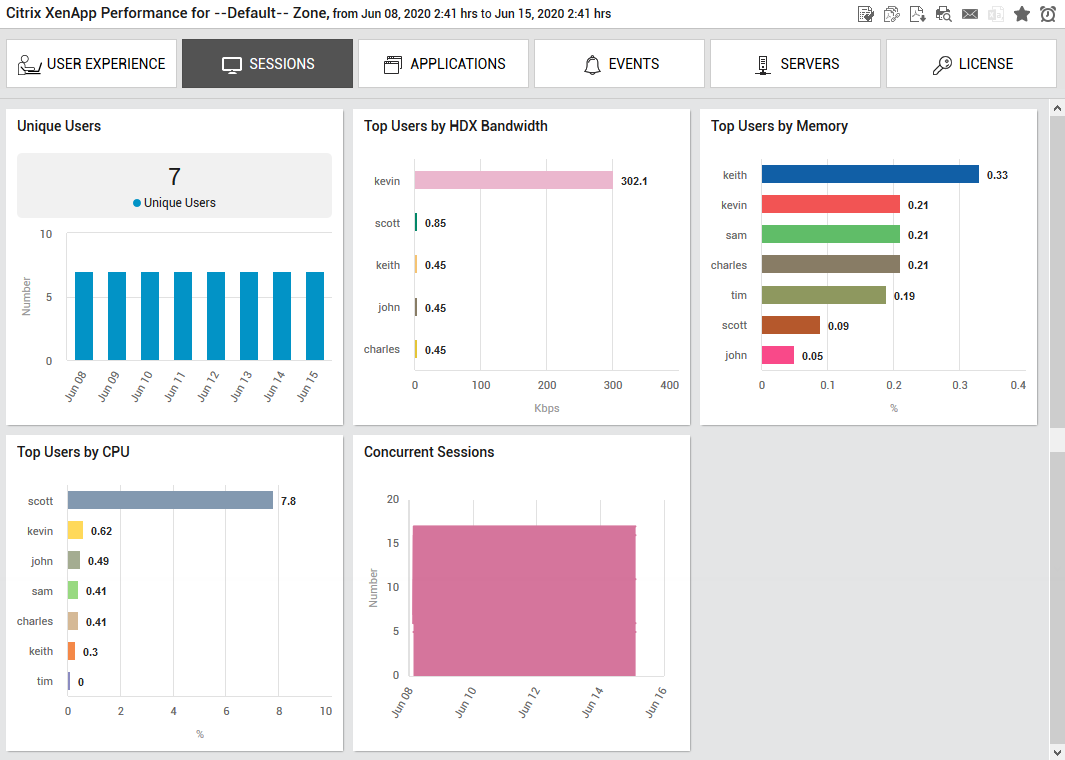
Figure 4 : The SESSIONS tab of the Citrix XenApp Overview report
Clicking on the bars in each section of Figure 4 will lead you to the appropriate report where you could perform in depth analysis of the sessions and users who initiated the sessions.
-
The APPLICATIONS tab (see Figure 5) helps administrators figure out the answers to the follwoing question using a series of graphs and charts:
- Which are the applications that consumed the maximum memory and CPU resources?
- How many unique users accessed the applications?
- Which application was frequently launched in the chosen time period and how many times the application was launched?
- How many instances of each application was running on each Citrix XenApp server during the chosen time period?
- Which applications took too long to be launched in the chosen time period?
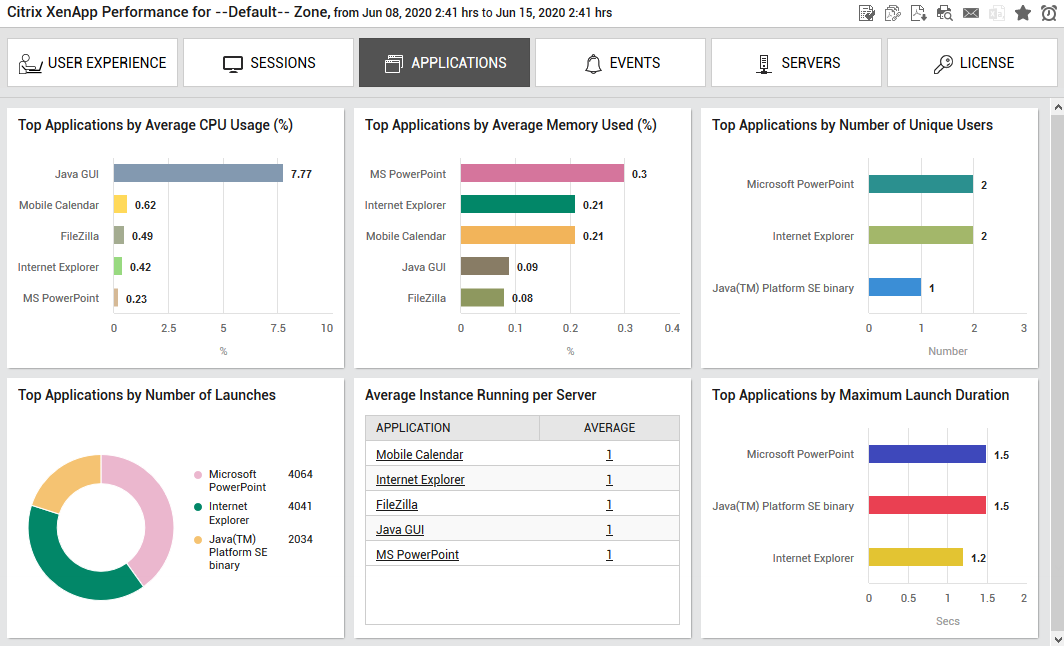
Figure 5 : The APPLICATIONS tab in the Citrix XenApp Overview report
Clicking on the graphs in each section of Figure 5 will lead you to the appropriate report where you could perform in depth analysis of the applications and the users who launched the applications.
-
The EVENTS tab (see Figure 6) reveals an overview of the alerts raised on the Citrix XenApp servers in the target environment and the events recorded in the event logs of the Citrix XenApp servers. Using this tab, administrators can figure out answers to the following questions:
- What is the alert distribution across the Citrix XenApp servers in the chosen time period? What percentage of alerts of each category were noticed in the Citrix XenApp servers?
- When exactly were more number of alerts raised? What category of alerts were noticed most of the time?
- Which server contributed to the maximum number of alerts?
- When exactly were abnormal events recorded on the Citrix XenApp servers were at peak?
- Which servers recorded the maximum abnormal events?
- Which users were responsible for the maximum number of abnormal events?
- Which source was most frequently identified for an abnormal event to be generated?
- How many times were events IDs that were assigned as abnormal events being generated?
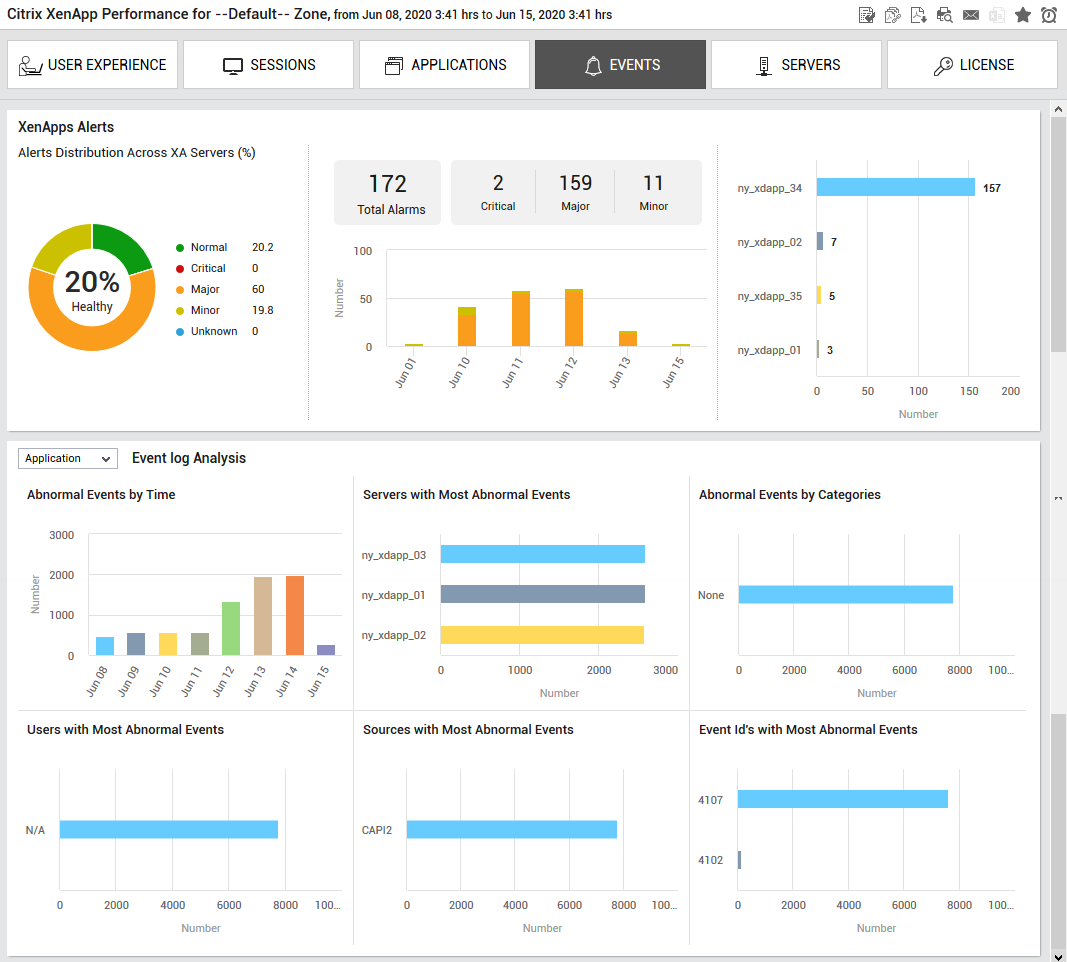
Figure 6 : The EVENTS tab of the Citrix XenApp Overview report
Clicking on the graphs in each section of Figure 6 will lead you to the appropriate report where you could perform in depth analysis on the alarms raised in the past and the event logs that were generated over a period of time.
-
The SERVERS tab (see Figure 7) reveals the answers to the following questions using a series of graphs:
- On which servers were maximum number of users logged in?
- On which servers were least number of users logged in?
- Which servers had the highest downtime?
- Which servers experienced the maximum number of application launches?
- Which servers experienced the least number of application launches?
- What was the resource utilization (Memory. CPU Disk busy) of the servers over a period of time?
- When exactly (day) did the resource utilization peaked in the chosen time period?
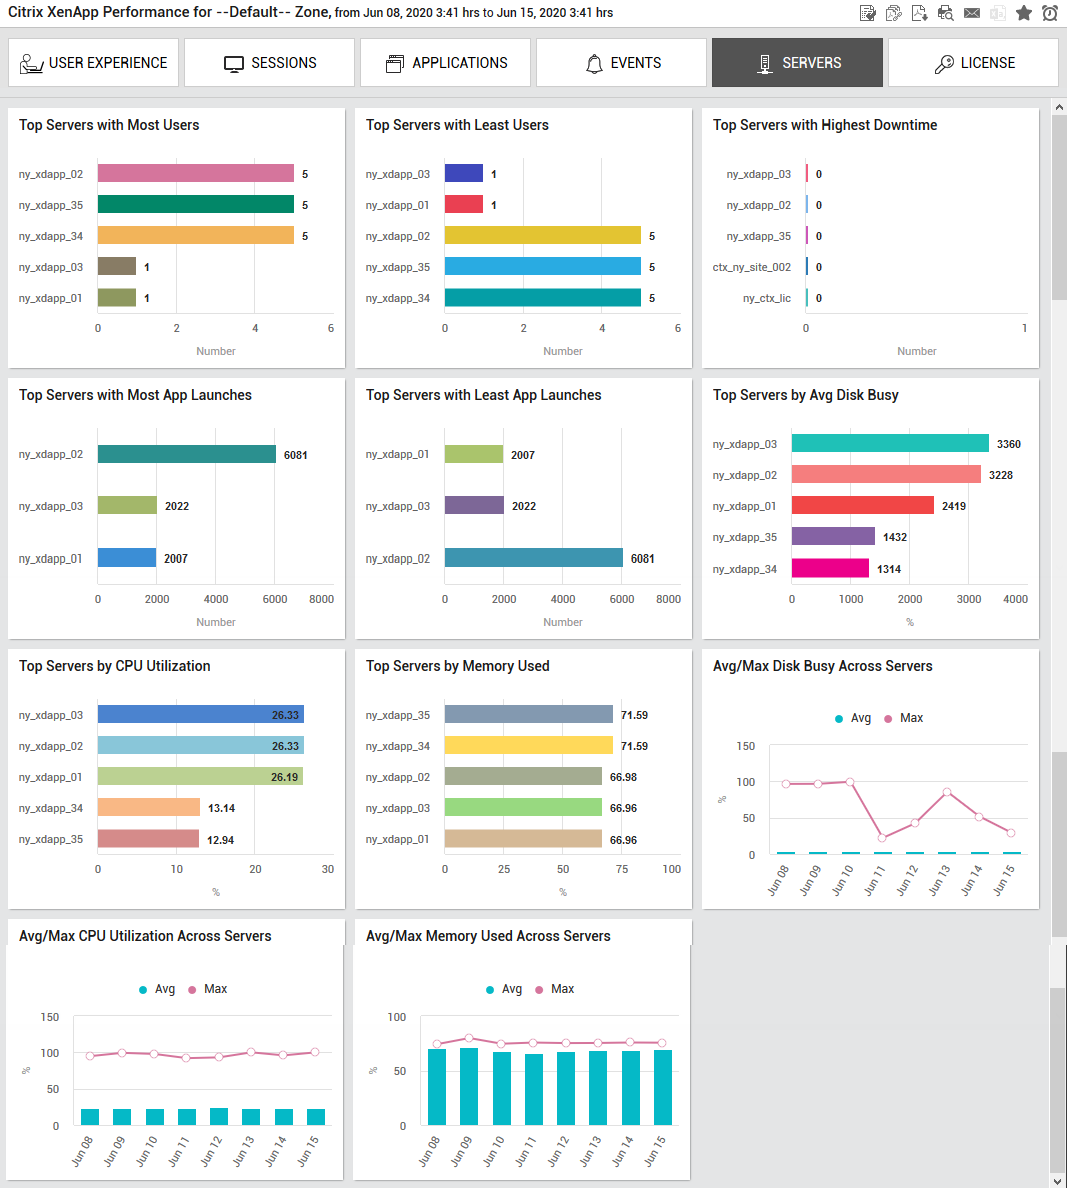
Figure 7 : The SERVERS tab of the Citrix XenApp Overview report
Clicking on the graphs in each section of Figure 7 will lead you to the appropriate report where you could perform in depth analysis of the servers and their resource utilization/consumption.
-
The LICENSE tab as shown in Figure 8 contains the License Usage Across Servers section that graphically represents the total count of installed licenses over a period of time, the used licenses and the licenses available for use over a period of time. This section helps administrators identify when the license utilization was at peak over a period of time. A consistently high utilization of licenses is an indication for the administrators to increase the licenses in the Citrix XenApp environment.
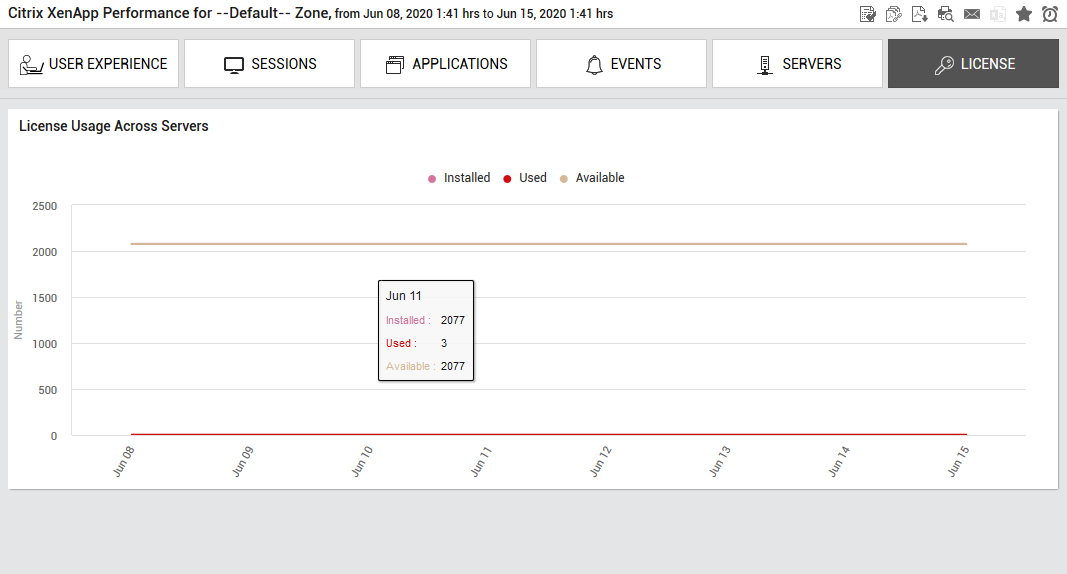
Figure 8 : The License tab revealing the License utilization over a period of time