Client Printer Analysis Report
In large Citrix XenApp environments, IT infrastructure operators require a wide range of reports that reveal the service level achieved by a target environment, intermittent breaks in service delivery (if any) to a printer, the reasons for such sudden breaks, how quickly was the service to the printer was restored, etc. To cater to these compliance requirements, the eG Reporter offers the Client Printer Analysis report.
While the Consolidated Event Log Analysis report helps administrators to pull event log data from multiple sources on multiple hosts across the target environment into a centralized database, so that efficient queries can be executed and the necessary event information viewed from a single interface, the Client Printer Analysis report helps administrators to retrieve the events specific to the Printer Management alone. This report helps to bring to light the errors/warnings/security breaches that could have hampered the normal functioning of the printers in the target environment.
To view a Client Printer Analysis report, do the following:
-
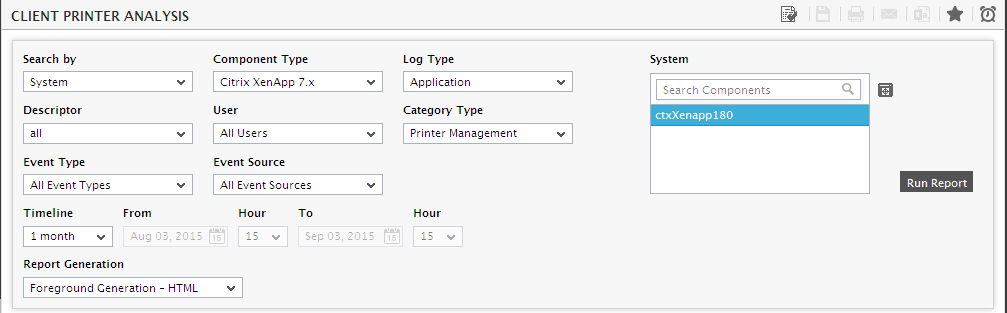
Select the Client Printer Analysis option by following the menu sequence: REPORTS BY FUNCTION -> Domain-specific Reports -> Virtual Applications / Desktops in the eG Reporter menu. Figure 1 will then appear.
-
From the Search by list of Figure 1, pick the criteria for searching for the hosts/systems from which event log information need to be extracted. The options are: Zone, Service, Segment, and System. If the Zone option is selected from the Search by list, then a Zone list box will appear. From this list, select the zone containing the hosts from which the event log details are to be collected. If you select the Service or Segment option from the Search by list, then a Service or Segment list box (as the case may be) will appear. From the corresponding list, select the Service or Segment containing the systems to participate in the event log aggregation. If you want to choose the candidates for log aggregation from across all managed systems in the environment, then select the System option from the Search by list.
Note:
If the hosts/systems from which event log information is to be retrieved are not part of any existing zone, then you can choose the Default option from the Zone list. This zone is automatically created by the eG Enterprise system, and includes all those infrastructure elements that are not mapped to any zone, segment, or service.
- If you select a particular Zone, Service, or Segment, then the Component Type list box will be populated with only those distinct Citrix XenApp 4/5/6.x and Citrix XenApp 7.x component types that belong to the chosen Zone, Service, or Segment. However, if the System option is chosen from the Search by list, then all the managed hosts/systems in the monitored environment will be displayed in the Component Type list box. From this list, select the specific component type for which the client printer analysis reports are to be generated.
- Once a Component Type is selected, the System list will automatically get populated with all the components pertaining to that particular component type. If the System list consists of too many components, then viewing all the components and selecting the ones you need for report generation could require endless scrolling. To avoid this, you can click the
 button next to the System list. The SYSTEM pop up window will then appear using which you can view almost all the components in a single interface and Select the ones for which the report is to be generated.
 - Next, pick the type of event logs for which the report is to be generated from the Log Type list. The options are: Application, Security, and System.
- Typically, the eG agent executes an ApplicationEventLog test, a SystemEventLog test, and a SecurityLog test on a host to extract statistics related to the application, system, and security events (respectively) that occur on that host. While configuring these tests, you can provide specific 'event source-ID-description' combinations to be monitored on the host. The Display Names assigned to these configured combinations will be the 'descriptors' of these tests. The Descriptor list in this page will be populated with these Display Names only. From this list, select the descriptor for which the client printer analysis report is to be generated. The default selection here is, All Descriptors.
- The Event Log metrics reported by the eG agent also include the name/ID of the user who triggered the events. The User list in this page consists of these users only. If you want a report on the events triggered by a particular user, select a user from this list. For events associated with all users, go with the default All Users option.
- If you want to view information related to a particular event type, select the Event Type of event from the list box. The contents of this list box will change based on the Log Type chosen. For instance, if the Log Type is Application, then the Event Type list will offer the following choices: Error, Information, Warning. On the other hand, if the Log Type is Security, then you have to choose from the following event types: Audit successes and Audit failures. The default selection however, is All Event Types, which reports the details of events of all types that have occurred on the chosen systems.
- By default, the Printer Management is chosen from the Category Type indicating that the details of events related to the printer on the chosen system alone will be reported.
- For details pertaining to a specific event source, select an Event Source from the list. The default selection is All Event Sources, which will retrieve details pertaining to all the event sources on the chosen systems.
-
Provide a report Timeline. You can either select a fixed timeline such as 1 hour, 2 days, etc., or choose the Any option from the Timeline list, and then provide a From and To date/time for report generation.
Note:
For every user registered with the eG Enterprise system, the administrator can indicate the maximum timeline for which that user can generate a report. Once the maximum timeline is set for a user, then, whenever that user logs into eG Reporter and attempts to generate a report, the Timeline list box in the report page will display options according to the maximum timeline setting of that user. For instance, if a user can generate a report for a maximum period of 3 days only, then 3 days will be the highest option displayed in the Timeline list - i.e., 3 days will be the last option in the fixed Timeline list. Similarly, if the user chooses the Any option from the Timeline list and proceeds to provide a start date and end date for report generation using the From and To specifications, eG Enterprise will first check if the user's Timeline specification conforms to his/her maximum timeline setting. If not, report generation will fail. For instance, for a user who is allowed to generate reports spanning over a maximum period of 3 days only, the difference between the From and To dates should never be over 3 days. If it is, then, upon clicking the Run Report button a message box will appear, prompting the user to change the From and To specification.
-
In addition to the settings discussed above, this report comes with a set of default specifications. These settings are hidden by default. If you do not want to disturb these default settings, then you can proceed to generate the report by clicking the Run Report button soon after you pick the criteria for generating the report. However, if you want to view and then alter these settings (if required), click on the
 icon. The default settings will then appear in the MORE OPTIONS drop down window (see Figure 2). The steps below discuss each of these settings and how they can be customized.
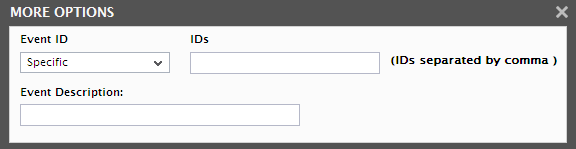
Figure 2 : The default settings for generating a Client Printer Analysis report
-
Next, from the Event ID list (see Figure 2), pick the criterion using which the event logs should be reported. You can choose from the following options:
- Specific: By default, the Specific option is chosen indicating that you can choose to filter specific event log IDs by providing a comma-separated IDs in the IDs text box.
- Range: If the Range option is chosen from the Event ID list then speicifying a From and To values will filter the event logs accordingly.
- If you wish to generate the report for the event logs that contain a specific string of your interest, then you can provide such information in the Event Description text box. For example, if you provide ‘protocol’ in this list box, then the event logs that comprise the word ‘protocol’ alone will be reported.
-
In large environments, reports generated using months of data can take a long time to complete. Administrators now have the option of generating reports on-line or in the background. When a report is scheduled for background generation, administrators can proceed with their other monitoring, diagnosis, and reporting tasks, while the eG manager is processing the report. This saves the administrator valuable time. To schedule background processing of a report, you can either select the Background Save - PDF option or the Background Save - CSV option from the Report Generation list. In this case, a Report Name text box will appear, where you would have to provide the name with which the report is to be saved in the background. To process reports in the foreground, select the Foreground Generation - HTML option from this list.
Note:
- The Report Generation list will appear only if the EnableBackgroundReport flag in the [BACKGROUND_PROCESS] section of the eg_report.ini file (in the {EG_INSTALL_DIR}\manager\config directory) is set to Yes.
- The default selection in the Report Generation list will change according to the Timeline specified for the report. If the Timeline set is greater than or equal to the number of days specified against the MinDurationForReport parameter in the [BACKGROUND_PROCESS] section of the eg_report.ini file, then the default selection in the Report Generation list will be Background Save - PDF. On the other hand, if the Timeline set for the report is lesser than the value of the MinDurationForReport parameter, then the default selection in the Report Generation list will be Foreground. This is because, the MinDurationForReport setting governs when reports are to be processed in the background. By default, this parameter is set to 2 weeks - this indicates that by default, reports with a timeline of 2 weeks and above will be processed in the background.
-
Finally, click the Run Report button to view the query results.
-
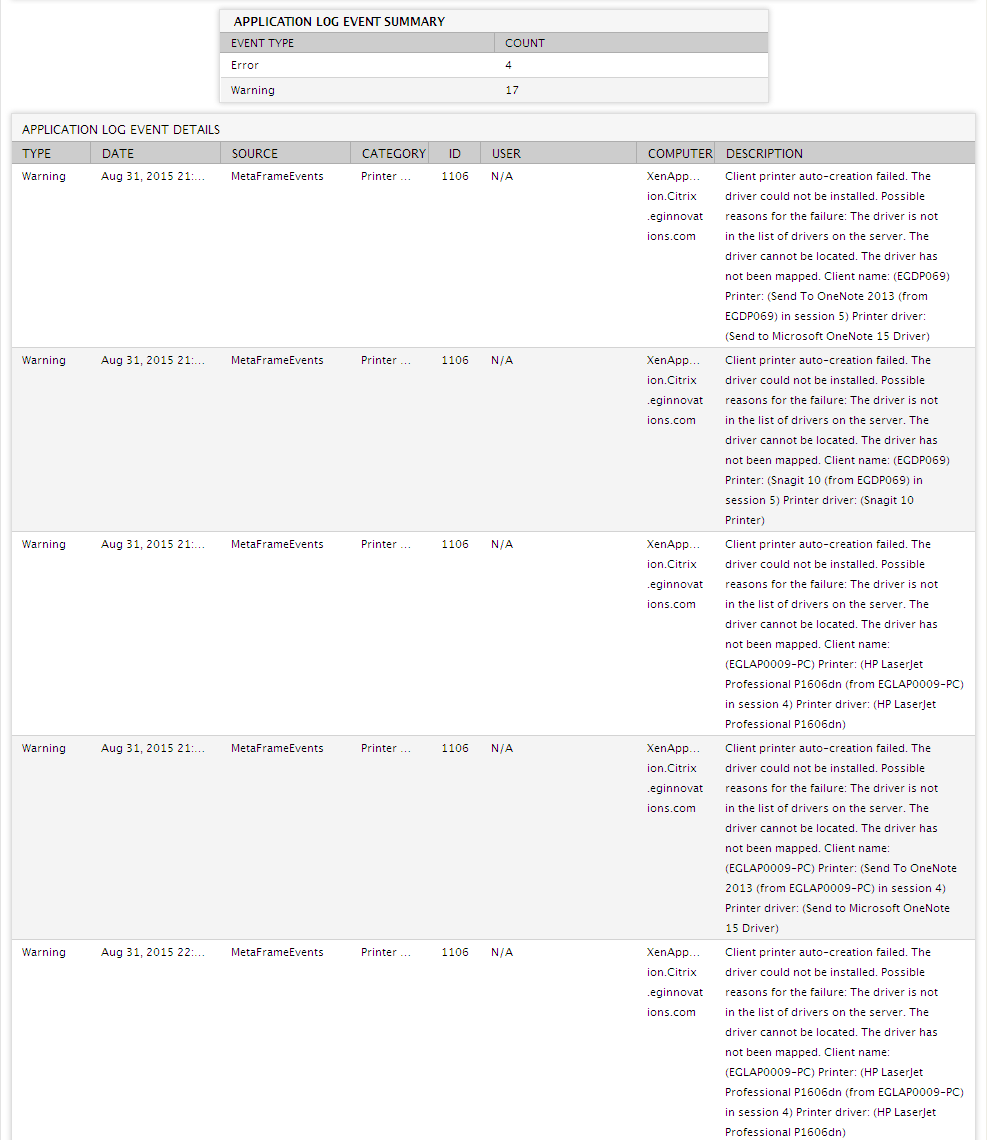
The resulting report (see Figure 3) will consist of two sections - a SUMMARY section that provides an event type-wise count of events, and a DETAILS section that provides the details of events logged; these details include:
- the event type
- the date/time on which the event occurred
- the event source
- the event category
- the event ID
- the user who is responsible for the occurrence of the event
- the system on which the event occurred
- a detailed description of the event