Snapshot Reports - Component
If the Analysis by Component option is chosen, the user can generate and view key information pertaining to a single/multiple tests associated with a chosen component. For example, to know how effectively a Microsoft SQL server had performed during a particular period, do the following:
- Select the Analysis by Component option from the Measurement Snapshots Reports sub node of the Analytical Reports node of the REPORTS BY FUNCTION tree.
- Figure 1 will then appear.
-
Administrators of large IT infrastructures, which are characterized by hundreds of components, may find it difficult to pick and choose the components for which a report is to be generated; this is because, in such environments, the Components list in this page will be populated with a large number of components, which would naturally make component selection tough. To enable administrators of such environments to quickly locate the components of interest to them and swiftly generate the reports, eG Enterprise provides a Report For list that consists of a variety of filter options. By default, the Component option is chosen from this list (see Figure 1) - this indicates that all the managed components of a chosen type will be available for selection in the Component list by default. In addition to this, the Report For list provides the following filter options as well:
- Service: If the component for which a report is to be generated is involved in the delivery of a particular service, then pick this option from the Report For list. Doing so will invoke a Service list from which a service name is to be chosen. Upon selection of a service, the component types that are part of the service will populate the ComponentType list in this page. Once you pick a component type, all components of that type, which are engaged in the delivery of the chosen service, will be displayed as candidates for selection in the Component list. If there are still too many components in the list to choose from, you can narrow your search further by using the Filter by text box. Specify the whole/part of the component name to search for in this text box, and click the right-arrow button next to it. The Component list will then be populated with all component names that embed the specified search string. Select the component of your choice from this list.
- Segment: If the components for which a report is to be generated is part of a segment, pick the Segment option from the Report For list. Then, select the segment of interest to you from the Segment list. This will populate the ComponentType list with the types of components that are part of the chosen segment. If you select a component type from the ComponentType list, then, all components of that type, which are part of the chosen segment, will be displayed in the Component list for selection. If there are still too many components in the list to choose from, you can narrow your search further by using the Filter by text box. Specify the whole/part of the component name to search for in this text box, and click the right-arrow button next to it. The Component list will then be populated with all component names that embed the specified search string. Select the component of your choice from this list.
- Zone: If the components for which a report is to be generated is part of a zone, pick the Zone option from the Report For list. To include sub-zones also in your search for components, set the Include SubZones flag to Yes. Then, select the zone of interest to you from the Zone list. This will populate the ComponentType list with the types of components that are part of the chosen zone. If you select a component type from the ComponentType list, then, all components of that type, which are part of the chosen zone, will be displayed in the Components list for selection. If there are too many components in the list to choose from, you can narrow your search further by using the Filter by text box. Specify the whole/part of the component name to search for in this text box, and click the right-arrow button next to it. The Component list will then be populated with all component names that embed the specified search string. Select the component of your choice from this list.
-
To view the data pertaining to a Microsoft SQL server, select the component from the Component list box of Figure 1. If you have too many components to choose from, you can narrow your search further by using the Filter by text box. Specify the whole/part of the component name to search for in this text box, and click the right-arrow button next to it. The Component list will then be populated with all component names that embed the specified search string. Select the component of your choice from this list.
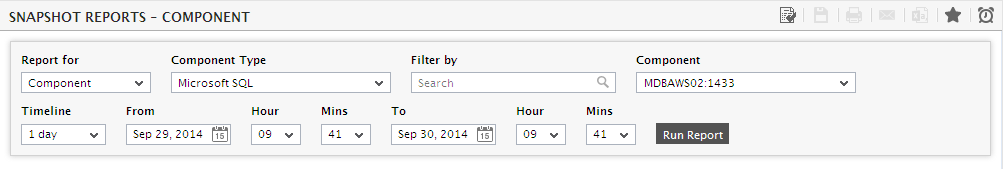
Figure 1 : Generating a Snapshot report for a chosen component
-
Next, using the Timeline option, specify the period to which the snapshot report should pertain.
Note:
For every user registered with the eG Enterprise system, the administrator can indicate the maximum timeline for which that user can generate a report. Once the maximum timeline is set for a user, then, whenever that user logs into eG Reporter and attempts to generate a report, the Timeline list box in the report page will display options according to the maximum timeline setting of that user. For instance, if a user can generate a report for a maximum period of 3 days only, then 3 days will be the highest option displayed in the Timeline list - i.e., 3 days will be the last option in the fixed Timeline list. Similarly, if the user chooses the Any option from the Timeline list and proceeds to provide a start date and end date for report generation using the From and To specifications, eG Enterprise will first check if the user's Timeline specification conforms to his/her maximum timeline setting. If not, report generation will fail. For instance, for a user who is allowed to generate reports spanning over a maximum period of 3 days only, the difference between the From and To dates should never be over 3 days. If it is, then, upon clicking the Run Report button a message box will appear, prompting the user to change the From and To specification.
-
In addition to the settings discussed above, this report comes with a set of default specifications. These settings are hidden by default. If you do not want to disturb these default settings, then you can proceed to generate the report by clicking the Run Report button soon after you pick a Component. However, if you want to view and then alter these settings (if required), click on the
 button. The MORE OPTIONS drop down window will then appear with the default settings as shown in Figure 2. The steps below discuss each of these settings and how they can be customized.
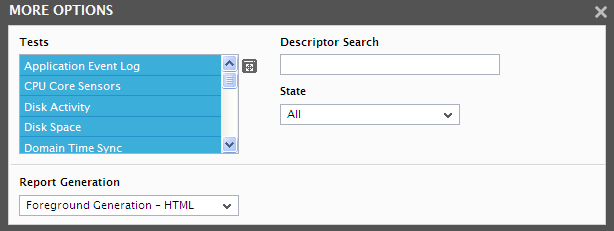
Figure 2 : The default settings for generating a Snapshot report for a chosen component
-
Now, select the test/tests for which a snapshot report is to be generated. Since our example involves assessment of the overall performance of the chosen component, select all the tests from the Tests list (see Figure 2). If the Tests list consists of too many tests, then viewing all the tests and selecting the ones you need for report generation could require endless scrolling. To avoid this, you can click the
 button next to the Tests list. This will expand the Tests list in the Tests pop up window (see Figure 3) using which you can view almost all the tests in a single interface and select the ones for which the report is to be generated.
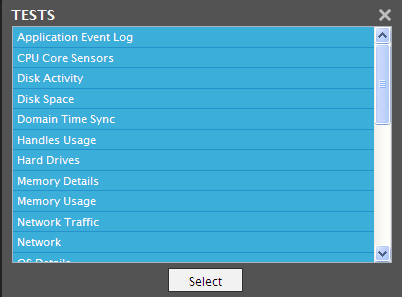
- If one/more of the chosen tests support descriptors, then, you can configure the snapshot report to display the historical information related to specific descriptors alone. For this, specify the whole/part of the descriptor name to search for in the Descriptor Search text box. The report in this case will display the historical measures of only those tests that support descriptors with names that embed the specified Descriptor Search string.
-
By default, the snapshot report displays all the metrics that were reported by the chosen tests during the given timeline, regardless of the state of the measures. This is why, the All option is chosen by default from the State list. If need be, you can have the report display the metrics of a particular state alone or a combination of states. For that, pick an option from the State list. The options provided by this list are as follows:
- Critical & Major
- Critical & Major & Minor
- Critical
- Major
- Minor
- Abnormal - if this option is chosen, then, measures that are of Critical, Major, Minor, and Unknown states will be displayed.
- Normal
- Unknown
-
In large environments, reports generated using months of data can take a long time to complete. Administrators now have the option of generating reports on-line or in the background. When a report is scheduled for background generation, administrators can proceed with their other monitoring, diagnosis, and reporting tasks, while the eG manager is processing the report. This saves the administrator valuable time. To schedule background processing of a report, you can either select the Background Save - PDF option or the Background Save - CSV option from the Report Generation list. In this case, a Report Name text box will appear, where you would have to provide the name with which the report is to be saved in the background. To process reports in the foreground, select the Foreground Generation - HTML option from this list.
Note:
- The Report Generation list will appear only if the EnableBackgroundReport flag in the [BACKGROUND_PROCESS] section of the eg_report.ini file (in the [EG_INSTALL_DIR]\manager\config directory) is set to Yes.
- The default selection in the Report Generation list will change according to the Timeline specified for the report. If the Timeline set is greater than or equal to the number of days specified against the MinDurationForReport parameter in the [BACKGROUND_PROCESS] section of the eg_report.ini file, then the default selection in the Report Generation list will be Background Save - PDF. On the other hand, if the Timeline set for the report is lesser than the value of the MinDurationForReport parameter, then the default selection in the Report Generation list will be Foreground. This is because, the MinDurationForReport setting governs when reports are to be processed in the background. By default, this parameter is set to 2 weeks - this indicates that by default, reports with a timeline of 2 weeks and above will be processed in the background.
- Finally, click on the Run Report button in Figure 1.
-
Figure 4 displays a snapshot report that focuses on only those measures that were in an Abnormal state during the chosen timeline.
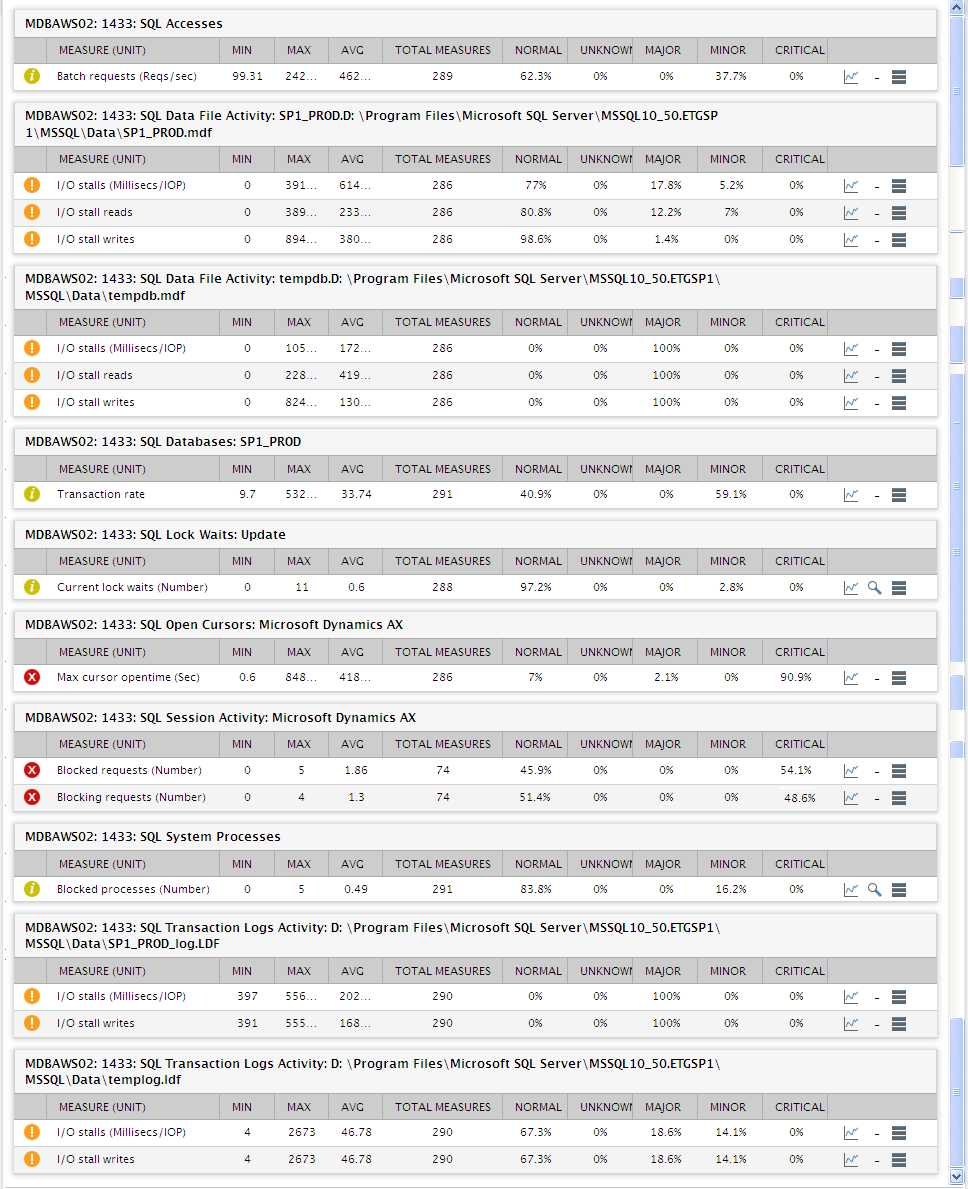
Figure 4 : The Snapshot report of a chosen component displaying metrics of an Abnormal state
-
If the Report Generation mode is set to Foreground Generation - html, then critical information pertaining to each of the tests executing on the Microsoft SQL server will then appear (see Figure 4). Such information includes:
- The Measure name
- A low watermark of the measure during the specified period
- A high watermark of the measure during the specified period
- The average measure value
- The total number of measurements
- The percentage of normal, critical, major, minor, and unknown measurements during the specified period
-
The measure name will be prefixed by an indicator of the state of the measure during the specified period. The state can be: Critical, Major, Minor, Normal, and Unknown. eG Enterprise determines the state of a measure during the given period, by applying the following norms:
- If the Critical % of the measure is greater than 0, then the state of the measure is Critical (
 ).
). - If the Critical % of the measure is 0, but the Major % is greater than 0, then the state of the measure is Major (
 ).
). - If the Critical and Major percentages are 0, but the Minor % is greater than 0, then the state of the measure is Minor (
 ).
). - If the Critical, Major, and Minor percentages are 0, but the Unknown % is greater than 50, then the state of the measure is Unknown (
 )
) - If the Normal % is 100%, then the state of the measure is Normal (
 ).
).
For example, take the case of the Max Cursor opentimemeasure of the SQL Open Cursors in Figure 4 above. In this case, note that though the Normal % of the measureis 7%, the state of the measure is Critical. This is because, the Critical % of the measure is 90.9 (which is greater than 0).
- If the Critical % of the measure is greater than 0, then the state of the measure is Critical (
- Clicking on the
 button against a measure will invoke a graph of the measure for the stated period.
 - Similarly, clicking on the Data button will provide the values that have been plotted on the graph. Here, values that have violated the set thresholds will be highlighted. While a value that has fallen below the threshold will be accompanied by a down arrow icon, the value that has exceeded the threshold will be accompanied by an up arrow icon.
- Clicking on the
 icon against a measure will provide you with detailed measures, which throw more light on the indicated problem condition.
 - On the other hand, if the Background Save - PDF option is chosen from the Report Generation list, then clicking on the Run Report button will not generate the report and display it in this page for your benefit. Instead, a message indicating that the report is being processed in the background will appear. This will be accompanied by a link that will lead you to the page that lists all the reports that are being processed in the background, and their current status. If background report generation fails for a report, you can regenerate that report using this page, or can even delete that report if need be. On the other hand, if background processing successfully completes for your report, then, you can view a PDF of the report by clicking on the
 icon in that page.