Comparison Reports - Components
The Comparison Reports - Components report allows administrators to compare statistics pertaining to selected components. For example, consider an environment comprising of a Web server supported by an Oracle server, Ldap server, and a Dns server (see Figure 1).
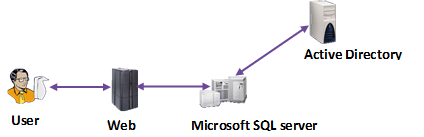
Figure 1 : A sample environment
Say that the web server in Figure 1 hosts a web site that depends upon the Microsoft SQL server for storage and recovery of critical data. The Microsoft SQL server uses the Active Directory server for authenticating user accesses.
Assume that the user accessing the web site (on the web server) begins to experience a marked deterioration in the responsiveness of the site. An increase in the response time of a web site could be caused by either/all of the following reasons:
- A network delay between the web server and the user
- A problem in the response time of one/all of the other servers (Microsoft SQL, Active Directory) that the web server relies on.
A comparison report provides an easy way of comparing the response times of each application.
To generate a comparison report for the above-mentioned scenario, do the following:
-
Select the Components option from the Comparison Reports sub node of the Analytical Reports node of the REPORTS BY FUNCTION tree.
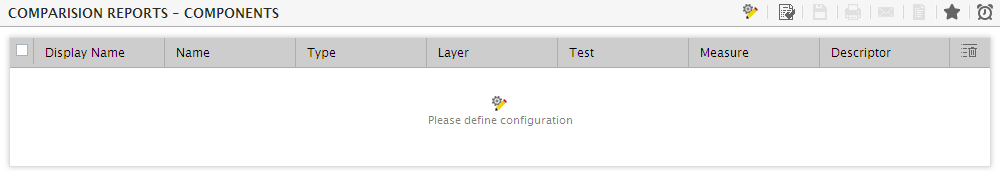
Figure 2 : Generating a Comparison Reports - Components report
-
will then appear. Click on the Please define configuration to specify the criteria for generating the comparison reports.
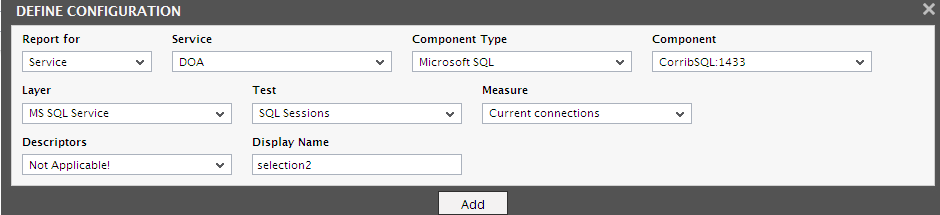
Figure 3 : Defining the configuration for generating the Comparison report
-
When Figure 3 appears, first, select a filter criterion from the Report for list box. Administrators of large IT infrastructures, which are characterized by hundreds of components, may find it difficult to pick and choose the components for which a report is to be generated; this is because, in such environments, the Component list in this page will be populated with a large number of components, which would naturally make component selection tough. To enable administrators of such environments to quickly locate the components of interest to them and swiftly generate the reports, eG Enterprise provides a Report for list that consists of a variety of filter options. By default, the Component option is chosen from this list - this indicates that all the managed components of a chosen type will be available for selection in the Component list by default. In addition to this, the Report for list provides the following filter options as well:
- Service: If the component for which reports are to be generated is involved in the delivery of a particular service, then pick this option from the Report for list. Doing so will invoke a Service list from which a service name is to be chosen. Upon selection of a service, the component types that are part of the service will populate the Component type list in this page. Once you pick a component type, all components of that type, which are engaged in the delivery of the chosen service, will be displayed as candidates for selection in the Components list. If there are still too many components in the list to choose from, you can narrow your search further by using the Filter by text box. Specify the whole/part of the component name to search for in this text box, and click the right-arrow button next to it. The Component list will then be populated with all component names that embed the specified search string. Select the component of your choice from this list.
- Segment: If the components for which a report is to be generated is part of a segment, pick the Segment option from the Report for list. Then, select the segment of interest to you from the Segment list. This will populate the Component type list with the types of components that are part of the chosen segment. If you select a component type from the Component type list, then, all components of that type, which are part of the chosen segment, will be displayed in the Components list for selection. If there are still too many components in the list to choose from, you can narrow your search further by using the Filter by text box. Specify the whole/part of the component name to search for in this text box, and click the right-arrow button next to it. The Component list will then be populated with all component names that embed the specified search string. Select the component of your choice from this list.
- Zone: If the components for which a report is to be generated is part of a zone, pick the Zone option from the Report for list. To include sub-zones also in your search for components, set the Include SubZones flag to Yes. Then, select the zone of interest to you from the Zone list. This will populate the Component type list with the types of components that are part of the chosen zone. If you select a component type from the Component type list, then, all components of that type, which are part of the chosen zone, will be displayed in the Components list for selection. If there are too many components in the list to choose from, you can narrow your search further by using the Filter by text box. Specify the whole/part of the component name to search for in this text box, and click the right-arrow button next to it. The Component list will then be populated with all component names that embed the specified search string. Select the component of your choice from this list.
- In the case of our example, the components to be compared are part of a web site service. Therefore, from the Report for list, select Service as the basis for comparison. Doing so populates the Service list in Figure 3 with the complete list of fully configured services in the environment. From this list, select the service for which the comparison report is to be generated.
- The Component list in Figure 3 will then be populated with the components that are involved in the delivery of the chosen Service. Pick the component that is a candidate for the comparison from this list.
- The Layer list box (see Figure 3) will now display the layers that are part of the layer model of the chosen component. From this list, select the Layer for which a graph is to be generated.
- Upon selection of a layer, the Test list box (see Figure 3) will display the tests associated with that layer. Select the Test that generates the measure for which a graph is to be generated.
- All the measures that will be generated by the selected test will then appear in the Measure list box (see Figure 3). From this list, pick the Measure that is to be included in the comparison report.
- If the chosen test consists of descriptors, then the same will be listed in the Descriptors list box. Select the descriptor that needs to be included for comparison.
- If a meaningful name for the specification should be displayed on the graph, provide a Display Name here.
- Now, add these specifications to the list box below by clicking the Add button (see Figure 3).
-
Similarly, add the specifications pertaining to all the measures that need to be compared and analyzed (see ). In our example, to compare response times, add the response time measure related to the web server, AD server, and Oracle server, and the Average delay measure pertaining to the web server.
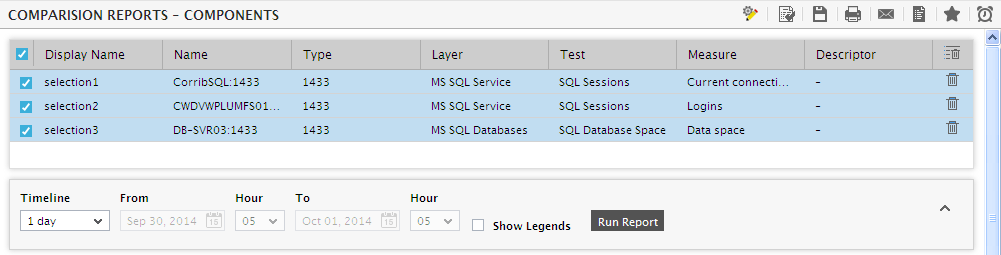
Figure 4 : Adding the measures to be compared
- If any of the added specifications need to be removed, click on the check box corresponding to the specification, and then click the
 button (see ). If all the specifications are to be removed at one shot, simply select the check box before the Display Name column in . Then, click the Remove button.
 - Next, from the added measures, select the ones for which a comparison graph is to be generated by clicking on the relevant check boxes. Since all the added measures in our example need to be compared, select them all.
-
Then, specify the Timeline for the graph. You can either provide a fixed time line such as 1 hour, 2 days, etc., or select the Any option from the list to provide a From and To date/time for report generation.
Note:
For every user registered with the eG Enterprise system, the administrator can indicate the maximum timeline for which that user can generate a report. Once the maximum timeline is set for a user, then, whenever that user logs into eG Reporter and attempts to generate a report, the Timeline list box in the report page will display options according to the maximum timeline setting of that user. For instance, if a user can generate a report for a maximum period of 3 days only, then 3 days will be the highest option displayed in the Timeline list - i.e., 3 days will be the last option in the fixed Timeline list. Similarly, if the user chooses the Any option from the Timeline list and proceeds to provide a start date and end date for report generation using the From and To specifications, eG Enterprise will first check if the user's Timeline specification conforms to his/her maximum timeline setting. If not, report generation will fail. For instance, for a user who is allowed to generate reports spanning over a maximum period of 3 days only, the difference between the From and To dates should never be over 3 days. If it is, then, upon clicking the Run Report button a message box will appear, prompting the user to change the From and To specification.
-
In addition to the settings discussed above, this report comes with a set of default specifications. These settings are hidden by default. If you do not want to disturb these default settings, then you can proceed to generate the report by clicking the Run Report button soon after you pick the measures that are to be compared. However, if you want to view and then alter these settings (if required), click on the
 button. The default settings will then appear in the MORE OPTIONS drop down window (see Figure 5). The steps below discuss each of these settings and how they can be customized.
Figure 5 : The default settings for generating the Comparison reports
- From Figure 5, select the Graph Type. To view a single graph that plots the values of all the selected measures, select the Single option. If individual graphs for each of the selected measures need to be viewed, then, select the Multiple option (see Figure 5).
-
The speed with which a report is generated depends primarily on the report Timeline. While a Timeline that varies between a couple of days to a week enables the eG Enterprise system to quickly retrieve the required data, timelines that span multiple weeks/months could slow-down the data retrieval and report generation process to a considerable extent, owing to the volume of data involved. In order to ensure quick and easy access to reports, eG Enterprise provides you the option of enabling data retrieval from the Trend information in the database, instead of the Detailed test information that is used by default for report generation. The Detailed test information base comprises of multiple measurement records for a test - one or more each for every test execution. Whereas, the Trend information includes only hourly, daily, and monthly summary computations for a test performed on a continuous basis. For instance, during a period of 1 hour, a test that runs every 5 minutes inserts atleast 12 records into the Detailed test information base. On the other hand, the Trend information base would consist of only 1 record for the same 1 hour period. Fewer the number of records, query execution becomes much quicker, and data retrieval faster. To use the trend data for report generation, you will have to select the Trend option from the Show Data field in Figure 5. By default, the Detailed option is selected in Figure 5 indicating that the report data is retrieved from the detailed test information in the database. If need be, you can also ensure that all reports always use the Detailed test tables alone by hiding the Show Data field from the reporter interface. To achieve this, do the following:
- Login to the eG administrative interface as 'admin'.
- Select the Manager option from the Settings tile that appears when the
 button against the Admin tab is clicked.
 -
From the GENERAL SETTINGS page that then appears, if you set the Compute average/sum of metrics while trending flag to No, then the Show Data field will not appear in the reporter interface; this denies users access to the Trend option, and thus ensures that reports are always generated using the Detailed tables.
Note:
- A Trendreport will not include the data for the current day since trend data is only computed at the end of the day. If the Trend option is chosen, the time period of the report should be greater than 1 day.
-
The usage of Detailed test tables for generating reports, especially those that span weeks, increases the stress on the eG database, thus resulting in undue delays in report generation. In order to ensure that the database is not choked by such voluminous data requests, you can configure eG Enterprise to automatically "force" the use of the Trend option if the Timeline of a report exceeds a pre-configured duration. To specify this time boundary, do the following:
- Edit the eg_report.ini file in the <EG_INSTALL_DIR>\manager\config directory.
- In the [MISC] section of the file, you will find a DetailedTime parameter.
- Specify the duration (in days) beyond which Detailed reports cannot be generated, against the DetailedTime parameter, and save the eg_report.ini file. For instance, to make sure that Detailed reports are disallowed for a Timeline of over 2 weeks, set the DetailedTime parameter to 14 and save the file. Say, subsequently, you attempt to generate a Detailed report for a Fixed Timeline of 3 weeks (which is greater than the 14-day limit set in our example). The instant you select the 3 weeks option from the Fixed list box, the Detailed option gets automatically disabled, and the Trend option gets enabled. Similarly, if you specify an Any Timeline that runs over 14 days, then, upon clicking the Run Report button to generate the report, a message box appears (see Figure 8) informing you that only the Trend option
- To proceed with the Trend report generation, click on the OK button in the message box. To terminate Trend report generation, click the Cancel button.
-
In large environments, reports generated using months of data can take a long time to complete. Administrators now have the option of generating reports on-line or in the background. When a report is scheduled for background generation, administrators can proceed with their other monitoring, diagnosis, and reporting tasks, while the eG manager is processing the report. This saves the administrator valuable time. To schedule background processing of a report, you can either select the Background Save - PDF option or the Background Save - CSV option from the Report Generation list. In this case, a Report Name text box will appear, where you would have to provide the name with which the report is to be saved in the background. To process reports in the foreground, select the Foreground Generation - HTML option from this list.
Note:
- The Report Generation list will appear only if the EnableBackgroundReport flag in the [BACKGROUND_PROCESS] section of the eg_report.ini file (in the {EG_INSTALL_DIR}\manager\config directory) is set to Yes.
- The default selection in the Report Generation list will change according to the Timeline specified for the report. If the Timeline set is greater than or equal to the number of days specified against the MinDurationForReport parameter in the [BACKGROUND_PROCESS] section of the eg_report.ini file, then the default selection in the Report Generation list will be Background Save - PDF. On the other hand, if the Timeline set for the report is lesser than the value of the MinDurationForReport parameter, then the default selection in the Report Generation list will be Foreground. This is because, the MinDurationForReport setting governs when reports are to be processed in the background. By default, this parameter is set to 2 weeks - this indicates that by default, reports with a timeline of 2 weeks and above will be processed in the background.
-
Finally, click the Run Report button to generate the graph. If the Graph Type is set to Single, and the option chosen from the Report Generation list is Foreground Generation - HTML, then, clicking on the Run Report button will invoke Figure 6.
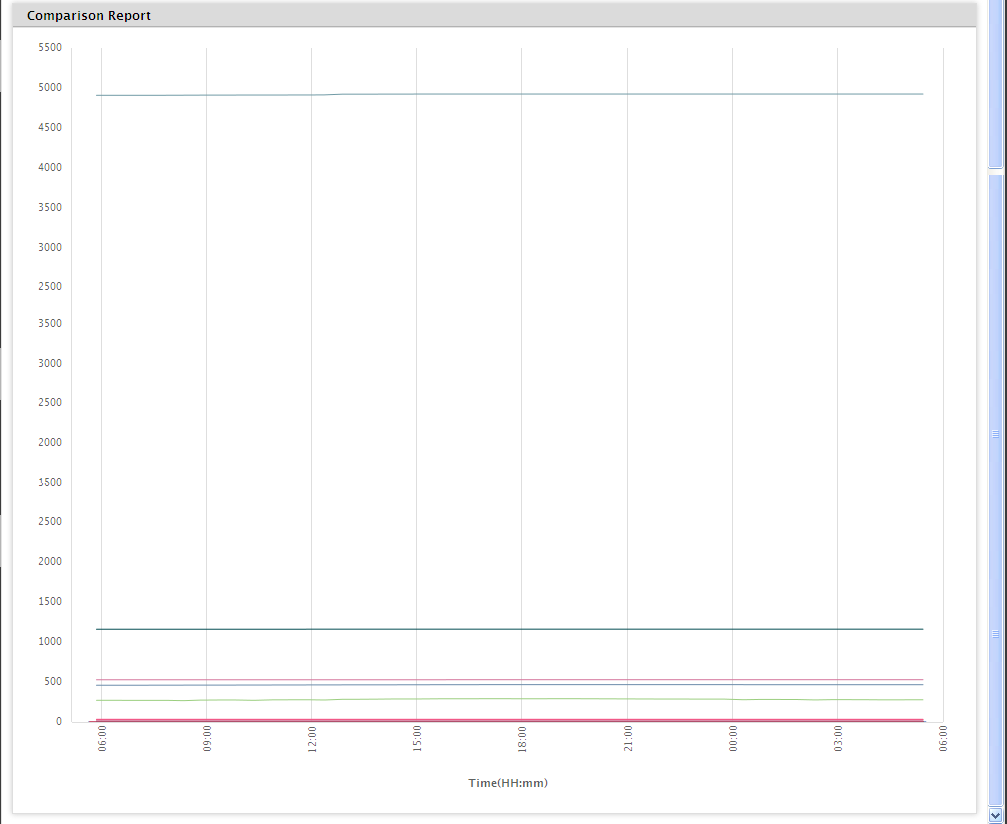
Figure 6 : A single comparison graph
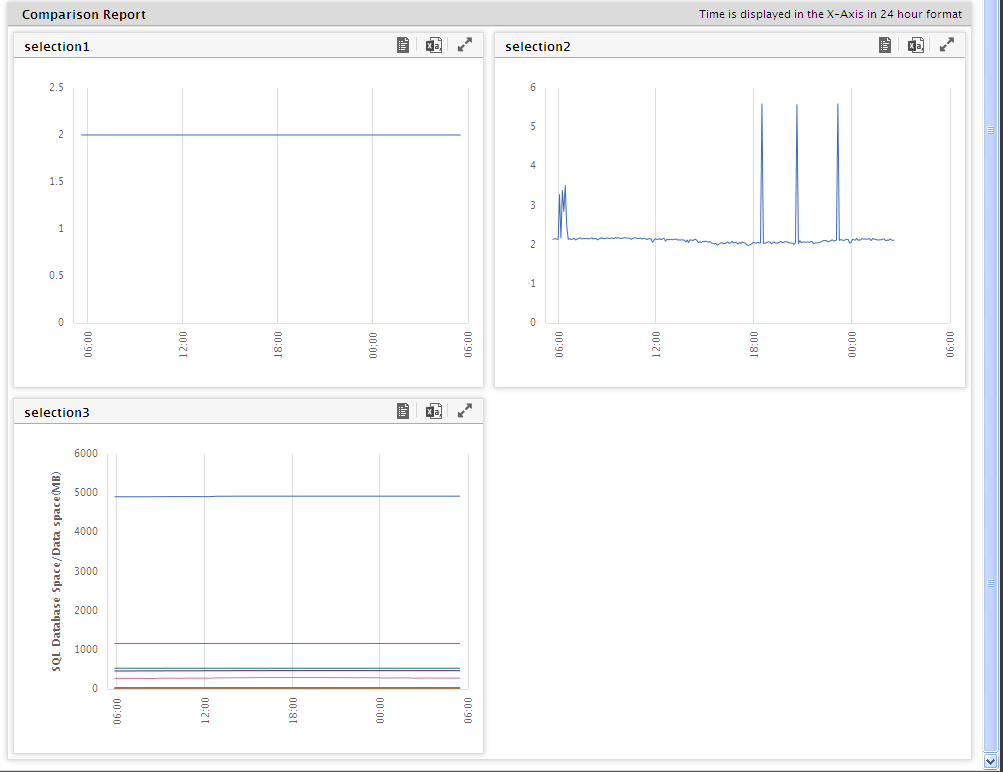
Figure 7 : Graph for each of the measures chosen for comparison
- Similarly, if the Graphtype chosen is Multiple and the option chosen from the Report Generation list is Foreground Generation - HTML, then, clicking on the Run Report button will invoke Figure 7. Both the figures clearly illustrate that the problem is not with the network, but with the Oracle server. Note that the Oracle server’s responsiveness has experienced quite a few surges during the specified Timeline. From Figure 6 and Figure 7, it is evident that the slow down in the Oracle server has only rippled to the web server, thereby affecting its performance.
-
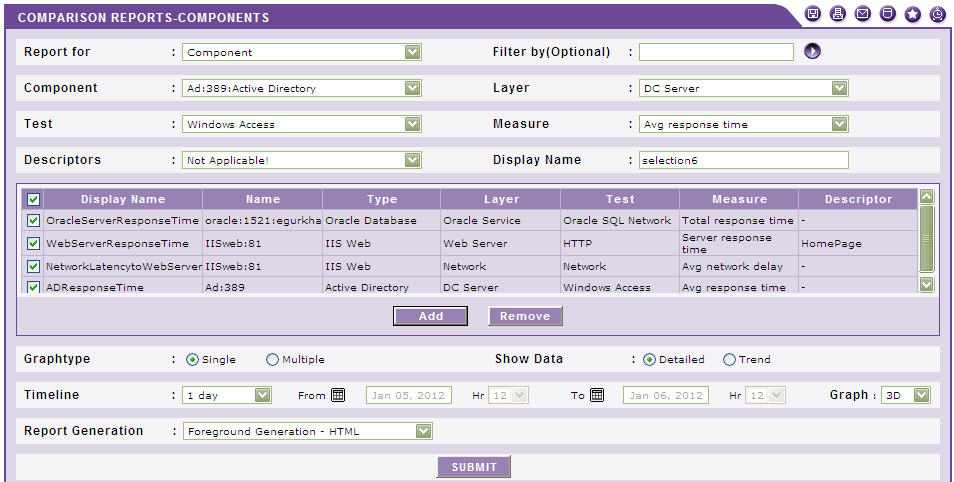
With that, we have demonstrated how to generate a report comparing the responsiveness of the components involved in the delivery of a web site service. As stated earlier, besides service components, the comparison reports page can be used to compare independent components, segment components, and even, zone components. For instance, to compare independent components, select Component from the Report for list, select an independent Component, pick the Layer, Test, Measure and Descriptor (if applicable) to be compared, and click the Add button (see Figure 8). This way, multiple components can be chosen for comparison.
-
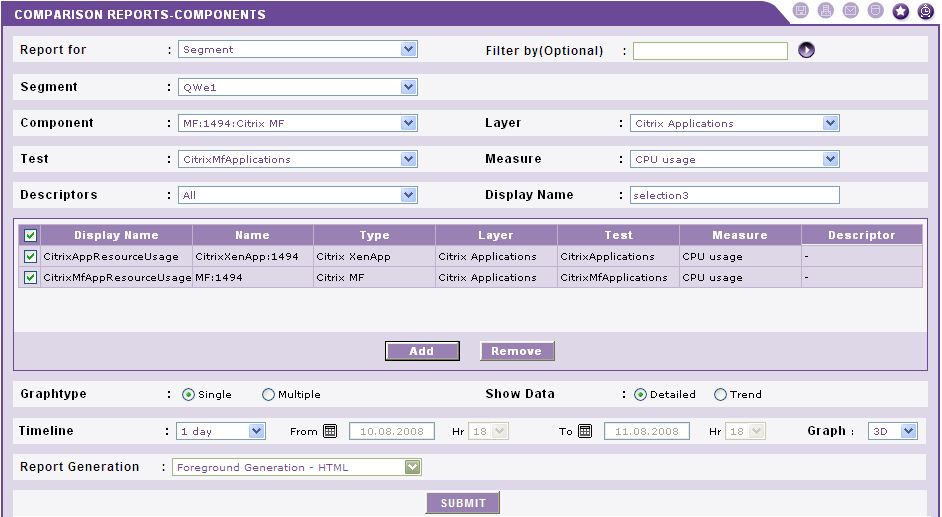
Similarly, to draw a performance comparison chart for segment components, select Segment from the Report for list, choose the Segment whose components are to be compared, select the segment Component that will participate in the comparative analysis, pick the Layer, Test, Measure and Descriptor (if applicable) to be compared, and click the Add button (see Figure 9). This way, multiple components from the same segment or across segments can be chosen for comparison.
-
Likewise, for comparing performance across a particular zone, select Zone from the Report for list, choose the Zone, select the zone Component that will participate in the comparison, pick the Layer, Test, Measure and Descriptor (if applicable) to be compared, and click the Add button (see Figure 10). In the same manner, multiple components from the same zone or across zones can be chosen for comparison.
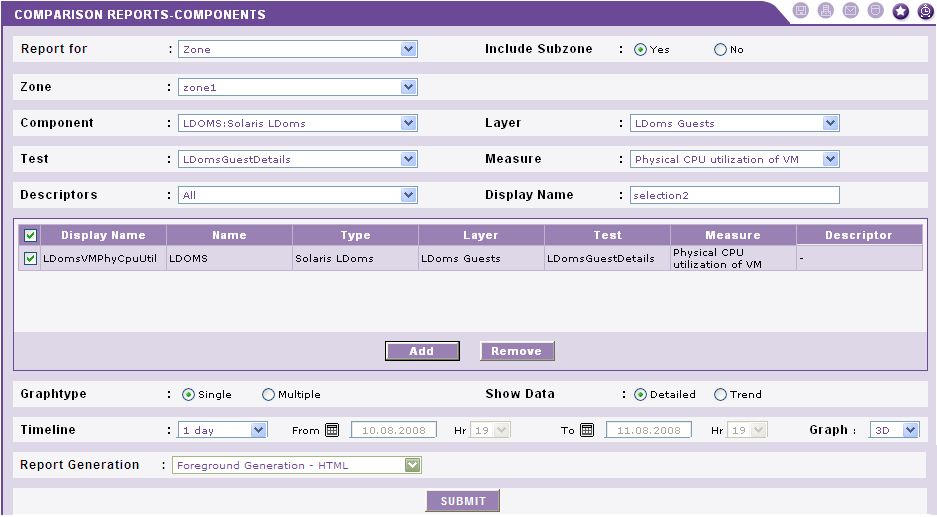
Figure 10 : Choosing the zone components to be included in the comparison
- On the other hand, if the Background Save - PDF option is chosen from the Report Generation list, then clicking on the Run Report button will not generate the report and display it in this page for your benefit. Instead, a message indicating that the report is being processed in the background will appear. This will be accompanied by a link that will lead you to the page that lists all the reports that are being processed in the background, and their current status. If background report generation fails for a report, you can regenerate that report using this page, or can even delete that report if need be. On the other hand, if background processing successfully completes for your report, then, you can view a PDF of the report by clicking on the
 icon in that page.