Configuring the Capacity Planning Reports
Configuring the Capacity planning reports involves the following broad steps:
- Enabling the Capacity Planning capability for specific tests
- Associating the Percentile policies that were created earlier with the measures reported by a test
To achieve this, do the following:
- In the eG administrative interface, follow the menu sequence: Settings -> Reporter -> Capacity Planning Reports.
- When Figure 1 appears, click on the Configure Tests tab page therein.
-
Then, pick a Component Type from Figure 1.
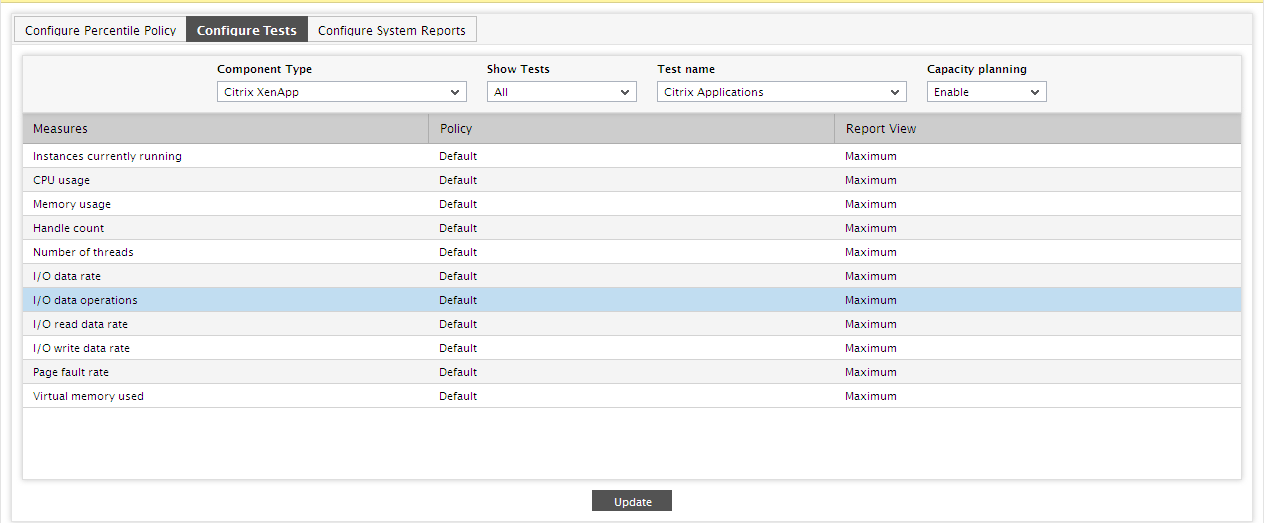
- By default, all tests associated with the chosen component-type will be listed in the Test Name list. Accordingly, the All option is chosen by default from the Show Tests list. To view only those tests for which the 'capacity planning capability' has already been enabled, pick the Capacity enabled option from the Show Tests list.
- Next, pick a Test Name. If the capacity planning capability is already enabled for the chosen test, then, the Capacity Planning flag will be set to Enabled by default. If the capability is not yet enabled for the chosen test, then the Capacity Planning flag will be set to Disabled by default. To enable this capability for the chosen test, select the Enabled option.
- Then, proceed to configure each measure of the selected test to compute percentile values while performing trending. For this, against each measure in Figure 1, pick the Percentile Policy that applies to that measure, and then, pick the Minimum or Maximum option from the Report View list to indicate which value of the selected Percentile Policy should be displayed in the report. This choice depends upon the nature of the measure - take the CPU utilized measure for instance; since the CPU resource requirement of a system can be ascertained based only on how high CPU usage was during a specific period of time in the past, it would make good sense to associate the Maximum percentile value with the CPU utilized measure. Similarly, in the case of the Free memory measure, where the memory requirement of a system can be determined by understanding how low the free memory value was during the given Timeline, it would be more meaningful if the Minimum percentile value is displayed in the report.
- Finally, click the Update button.
-
Each measure will now be automatically associated with the Percentile Policy chosen from Figure 1. To view which measures a particular percentile policy is associated, click the Configure Percentile Policy tab page in Figure 1. Figure 2 appears listing all the percentile policies that pre-exist.
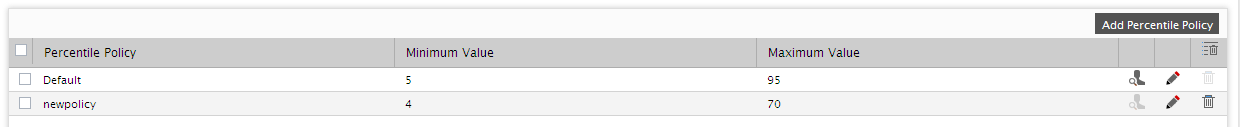
- If any of the policies listed in Figure 2 have already been associated with one/more measures, a
 button will appear as shown in Figure 2.
 -
If you click on this button corresponding to a measure, Figure 3 will appear listing all those measures to which the chosen percentile policy has been assigned.
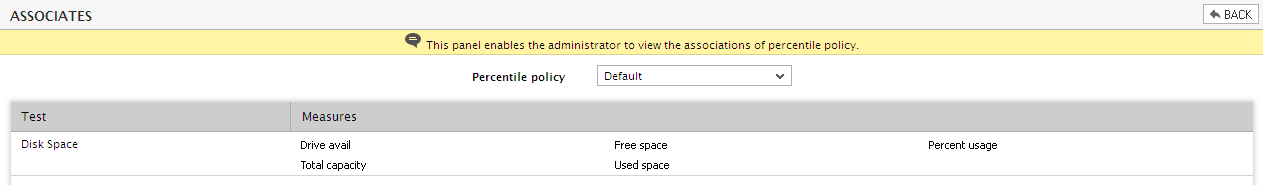
Figure 3 : Viewing the measures that are associated with a percentile policy