Configuring the Capacity Planning System Report Settings
If a system is configured with sufficient CPU, memory, bandwidth, and disk resources, the applications executing on it seldom suffer performance degradations. Therefore, when planning the capacity of their mission-critical applications/business services, administrators need to historically analyze how the systems hosting these applications/supporting these business services used the physical resources that were at their disposal, identify usage bottlenecks, and if required, recommend changes in system size as part of their capacity plans, so that unpleasant application crashes or service outages can be averted in the future. Such a detailed appraisal of system-level resource usage can be performed using the Systems Capacity Planning Report.
For each critical system resource that is monitored (CPU, memory, disk space, disk activity, and bandwidth), this report computes and displays how that resource was utilized on an average (Avg) during a given timeline and also computes the 95th percentile value of the corresponding usage measure. In addition, by comparing the 95 percentile value with user-configured thresholds for the same, the report promptly detects and highlights resource usage bottlenecks and the severity of these bottlenecks.
To configure the thresholds that should govern the 95th percentile value of the resource usage measures, do the following:
- Follow the Configure -> Reporter -> Capacity Planning Reports menu sequence.
-
When Figure 1 appears, click on the Configure System Reports tab page therein. When this is done, the measures that capture system resource usage will be displayed - namely, CPU utilization, Physical memory utilized, Percent disk space usage, Disk busy percentage, and Bandwidth usage.
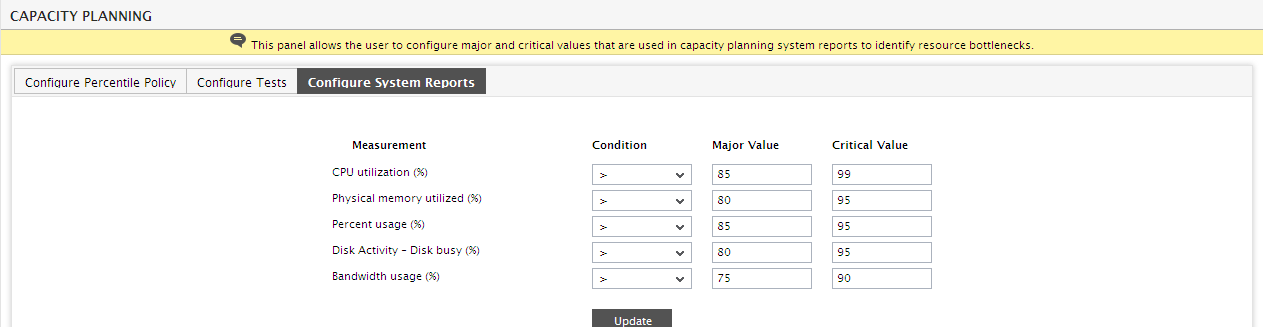
Figure 1 : Configuring the thresholds that govern the 95th percentile value of resource usage metrics
-
You can change the display name of any of these measures by clicking on the corresponding
 icon. Doing so will invoke a small Display name pop-up (see Figure 2), specify the display name of your choice, and click the Update button.
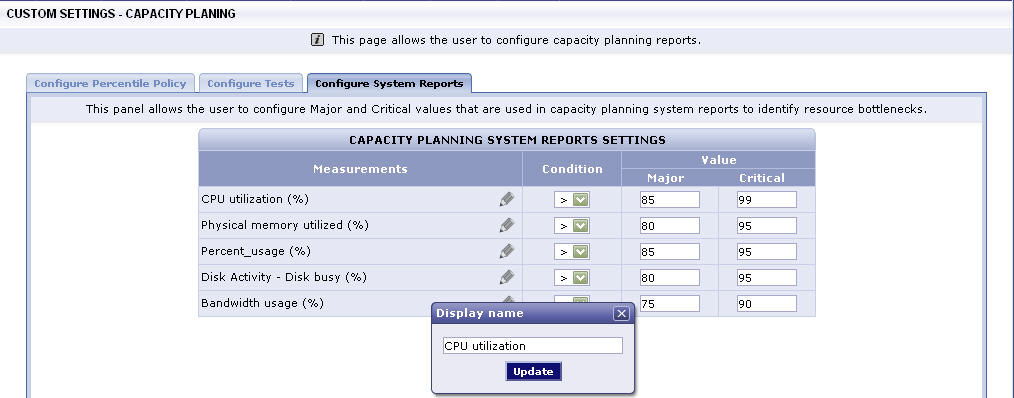
- To begin configuring the thresholds for a measure, pick a Condition. This can be > (greater than) or < (lesser than).
- Then, specify the Major Value and/or Critical Values (thresholds) for the measure. In the same way, you can configure thresholds for the remaining measures. Finally, click the Update button to save the threshold settings.
- If the > Condition is chosen for a measure, then, during report generation, the eG Enterprise system will check whether the 95th percentile value of that measure is 'greater than' its Major threshold configuration or Critical threshold configuration. Likewise, if the < Condition is chosen, then the eG Enterprise system will check whether the 95th percentile value is 'lesser than' the Major or Critical threshold configuration. If the Major threshold has been violated, then the corresponding measure value will be highlighted in Orange in the report. Similarly, a Critical threshold violation will result in the 95th percentile value being highlighted in Red in the report.