Cumulation Analysis Report
The Cumulation Analysis Report plots the cumulative values of a chosen measure across descriptors/components, for a specified timeline. For instance, you can generate a Cumulation Analysis Report that plots the cumulative values of disk space usage for each of the disk partitions of a component. Likewise, you can configure a Cumulation Analysis Report to indicate the cumulative space usage of all servers that share the storage resources in a SAN environment. Such reports not only reveal the total space usage of the individual servers/disk partitions (as the case may be), but also reveal the overall space usage across the servers/disk partitions. This way, you will not only be able to pinpoint the resource-hungry elements in your infrastructure, but will also be able to assess how well/poorly the resource in its entirety was utilized during the given timeline. Based on these inputs, you can accurately forecast the future usage of your critical systems/servers, and plan their capacity accordingly.
To generate a Cumulation Analysis Report, do the following:
- Select the Cumulation Analysis option from the Analytical Reports node of the REPORTS BY FUNCTION tree.
-
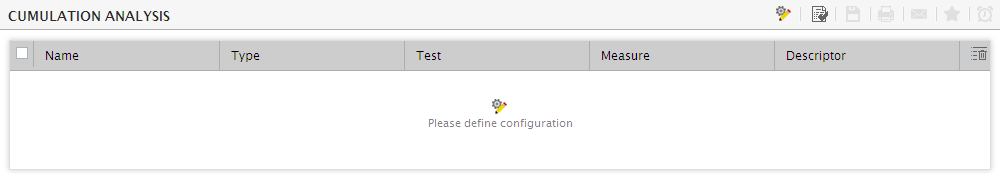
Figure 1 will then appear.
-
Clicking the Please define configuration link on Figure 1 will reveal Figure 2 using which you can define the configuration for generating the Cumulation Analysis report.
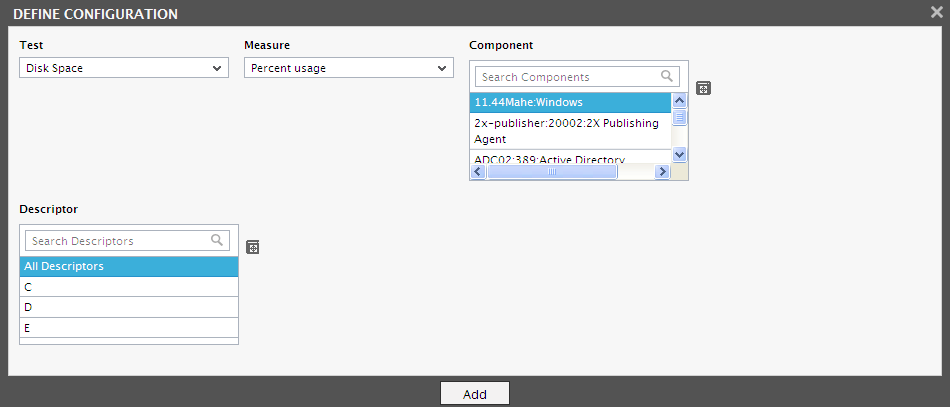
Figure 2 : Defining the configuration for generating the Cumulation Analysis report
- First, select the Test for which the report is to be generated (see Figure 2).
- All measures of the chosen test will then populate the Measure list. From this list, pick the measure for which the report is to be generated.
- All managed components to which the chosen Test-Measure combination applies will then be listed in the Component list. Select one or more components for report generation from this list. If the Component list consists of too many components, then viewing all the components and selecting the ones you need for report generation could require endless scrolling. To avoid this, you can click the
 button next to the Component list. The COMPONENT pop up window will then appear using which you can view almost all the components in a single interface and select the ones for which the report is to be generated.
 - If the chosen Test supports descriptors, then the Descriptor list will display all descriptors. To generate a report that plots the cumulative values of specific descriptors, select those descriptors alone. For a report on all descriptors, pick the All Descriptors option. If the Descriptor list consists of too many descriptors, then viewing all the descriptors and selecting the ones you need for report generation could require endless scrolling. To avoid this, you can click the button next to the Descriptor list. The DESCRIPTOR pop up window will then appear using which so that you can view almost all the descriptors in a single interface and select the ones for which the report is to be generated.
-
Click the Add button to add the specifications as shown in Figure 2. Likewise, you can add multiple specifications.
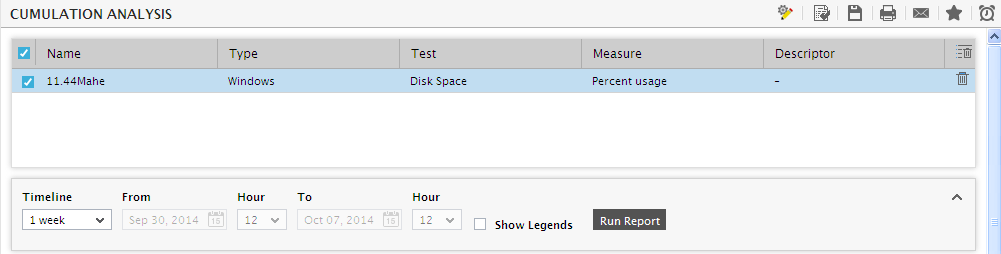
Figure 3 : Generating a Cumulation Report
- To remove a specification, select the check box corresponding to it and click the
 button.
 -
Then, specify the report Timeline.
Note:
For every user registered with the eG Enterprise system, the administrator can indicate the maximum timeline for which that user can generate a report. Once the maximum timeline is set for a user, then, whenever that user logs into eG Reporter and attempts to generate a report, the Timeline list box in the report page will display options according to the maximum timeline setting of that user. For instance, if a user can generate a report for a maximum period of 3 days only, then 3 days will be the highest option displayed in the Timeline list - i.e., 3 days will be the last option in the fixed Timeline list. Similarly, if the user chooses the Any option from the Timeline list and proceeds to provide a start date and end date for report generation using the From and To specifications, eG Enterprise will first check if the user's Timeline specification conforms to his/her maximum timeline setting. If not, report generation will fail. For instance, for a user who is allowed to generate reports spanning over a maximum period of 3 days only, the difference between the From and To dates should never be over 3 days. If it is, then, upon clicking the Run Report button a message box will appear, prompting the user to change the From and To specification.
-
In addition to the settings discussed above, this report comes with a set of default specifications. These settings are hidden by default. If you do not want to disturb these default settings, then you can proceed to generate the report by clicking the Run Report button soon after you pick the criteria for generating the report. However, if you want to view and then alter these settings (if required), click on the
 icon. The default settings will then appear in the MORE OPTIONS drop down window (see Figure 4). The steps below discuss each of these settings and how they can be customized.
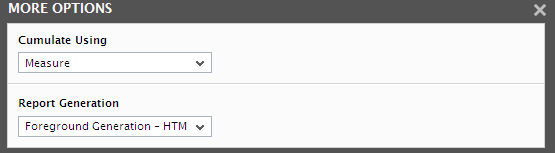
Figure 4 : The default settings for generating a Cumulation Analysis report
-
Next, by choosing an option from the Cumulate Using list, you can indicate what values of the chosen measure are to be cumulated for the report. The options are as follows:
- Measure: Select this option if you want to cumulate the real-time values reported by the chosen measure during the specified timeline.
- Min Trend: Select this option if you want to cumulate only the minimum trend values computed for the chosen measure during the specified timeline. Pick an option from the Report Summary list to indicate the trend values to be considered for the cumulation - the Hourly Summary, Daily Summary, or Monthly Summary. For instance, if the Min Trend and Hourly Summary options are chosen from the respective list boxes, then the lower of the trend values computed every hour during the specified timeline will be cumulated for the report. Say, you generate a report for the Free memory measure using the cumulative minimum hourly trend values; with the help of such a report, you to ascertain the minimum amount of memory that should be provisioned for a system/server to function smoothly.
- Max Trend: Select this option if you want to cumulate only the maximum trend values computed for the chosen measure during the specified timeline. Pick an option from the Report Summary list to indicate the trend values to be considered for the cumulation - the Hourly Summary, Daily Summary, or Monthly Summary. For instance, if the Max Trend and Hourly Summary options are chosen from the respective list boxes, then the higher of the trend values computed every hour during the specified timeline will be cumulated for the report. Say, you generate a report for the CPU utilization measure using the cumulative maximum hourly trend values; with the help of such a report, you can determine how high the CPU usage of a system/server can rise, and whether more processors need to be added to balance the CPU load.
-
In large environments, reports generated using months of data can take a long time to complete. Administrators now have the option of generating reports on-line or in the background. When a report is scheduled for background generation, administrators can proceed with their other monitoring, diagnosis, and reporting tasks, while the eG manager is processing the report. This saves the administrator valuable time. To schedule background processing of a report, select the Background Save - PDF option from the Report Generation list. In this case, a Report Name text box will appear, where you would have to provide the name with which the report is to be saved in the background. To process reports in the foreground, select the Foreground Generation - HTML option from this list.
Note:
- The Report Generation list will appear only if the EnableBackgroundReport flag in the [BACKGROUND_PROCESS] section of the eg_report.ini file (in the [EG_INSTALL_DIR]\manager\config directory) is set to Yes.
- The default selection in the Report Generation list will change according to the Timeline specified for the report. If the Timeline set is greater than or equal to the number of days specified against the MinDurationForReport parameter in the [BACKGROUND_PROCESS] section of the eg_report.ini file, then the default selection in the Report Generation list will be Background Save - PDF. On the other hand, if the Timeline set for the report is lesser than the value of the MinDurationForReport parameter, then the default selection in the Report Generation list will be Foreground. This is because, the MinDurationForReport setting governs when reports are to be processed in the background. By default, this parameter is set to 2 weeks - this indicates that by default, reports with a timeline of 2 weeks and above will be processed in the background.
-
Finally, click the Run Report button. If the Foreground Generation - HTML option is chosen from the Report Generation list, a Cumulation Analysis Report depicted by Figure 5 will appear.
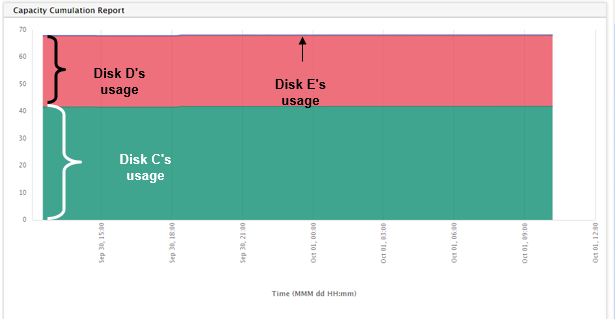
- The report in Figure 5 plots the cumulative values of disk space usage for each of the disk partitions on a system during the last week. Typically, any cumulation report generated by the eG Reporter will plot values in a 'stack format', so that users can easily determine total usage and per-descriptor usage in a single glance. For instance, from Figure 5 it is evident that disk C has consumed a total of 41% of the disk space during the last week - the shaded portion in the graph between 0 and 41% indicates C's usage. It can also be inferred that disk C and disk D together have consumed a total of 67% of the disk space on the system. Since disk D's usage is stacked on top of disk C's usage, the shaded area of the graph between 41 and 67% alone denotes disk D's usage. Disk D's usage therefore amounts to another 26% (61-47=26) of the total disk space. Likewise, disk E's usage is stacked on top of Disk D's usage in the graph, covering a small area. This implies that while disk E consumed a meager amount of disk space say 0.5% of the total disk space, all three disk partitions (C, D, and E) together have eroded a total of 68% of the available disk space.
- If the Background Save - PDF option is chosen from the Report Generation list, then clicking on the Run Report button will not generate the report and display it in this page for your benefit. Instead, a message indicating that the report is being processed in the background will appear. This will be accompanied by a link that will lead you to the page that lists all the reports that are being processed in the background, and their current status. If background report generation fails for a report, you can regenerate that report using this page, or can even delete that report if need be. On the other hand, if background processing successfully completes for your report, then, you can view a PDF of the report by clicking on the
 icon in that page.