Horizon Connection Brokering - Long-Running Sessions Report
In virtual desktop environments where effective management of the resources is vital, the users logging into the virtual desktops are expected to utilize the sessions optimally. When more user sessions are initiated with the available resources, users may feel a lag in their sessions. This is due to minimal resources available to them for accessing the applications. Administrators of such environments must identify the users who have initiated the sessions longer than the usual time and figure out if they are genuinely accessing the applications or are just idle and consuming the resources alone. The Long-Running Sessions report helps administrators identify such users who have initiated longer sessions. The total sessions initiated in the environment and the sessions that are running for a longer duration are highlighted. The concurrent user sessions and the long running sessions are identified on a day to day basis so that administrators can figure out the date/time on which too many long sessions and concurrent sessions have been initiated.
To generate this report, do the following:
- Follow the menu sequence: REPORTS BY FUNCTION -> Domain-specific Reports -> Virtual Applications / Desktops (
-
Figure 1 then appears. In Figure 1, select a criteria for analysis from the Analyze By list box.
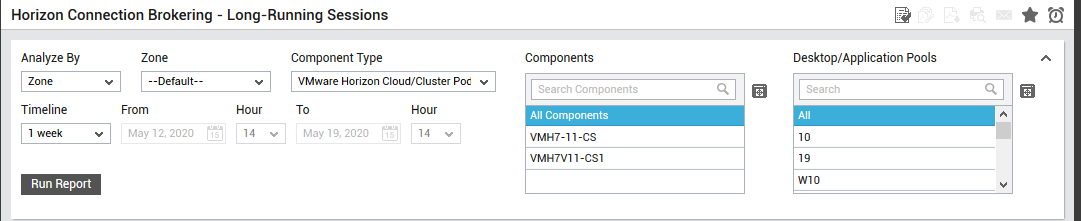
Figure 1 : Specifying the criteria for generating the Long-Running Sessions report
-
Using this report, you can analyze the long running sessions initiated on one/more managed components, or those that are part of a zone, service or segment. The options provided by the Analyze By list box are discussed hereunder:
- Component: Select this option to choose the component(s) from across all the managed components in the environment.
- Zone: To generate a report for one/more components that are included in a zone, pick the Zone option. A Zone drop-down list will then appear, from which you would have to select the zone to which the components of interest to you belong. A Sub zone flag also appears. Indicate whether the components present within the sub-zones of the chosen zone are also to be to be considered for report generation, by setting the Sub zone flag to Yes.
- Segment: If you want to generate a report for one/more chosen components that belong to a segment, select the Segment option from Analyze By list box, and then pick the Segment from the drop-down list that appears.
- Service: If you want to generate a report for one/more components involved in the delivery of a service, select the Service option from Analyze By, and then pick the required Service from the drop-down list that appears.
- Choose a Component Type for which the report is to be generated.
- The Components list will now be populated with all the components that are managed in your environment for the chosen component type. If the Components list consists of too many components, then viewing all the components and selecting the ones you need for report generation could require endless scrolling. To avoid this, you can click the
 button next to the Components list. A Components pop up window will then appear using which you can view almost all the components in a single interface and Select the ones to be included in this report.
 - Once the Component Type is chosen, the Desktop / Application Pools list will now be populated with all the desktop/applicationpools that were created on the chosen server (component). By default, this report will be generated for all desktop / application pools. To this effect, AIl option will be chosen from this list. If you wish to choose individual desktop pools, then you can do so. If the Desktop / Application Pools list consists of too many desktop pools, then viewing all the pools and selecting the ones you need for report generation could require endless scrolling. To avoid this, you can click the button next to the Desktop / Application Pools list. A Desktop / Application Pools pop up window will then appear using which you can view almost all the desktop pools in a single interface and Select the ones to be included in this report.
-
Then, specify the Timeline for generating this report. You can either provide a fixed time line such as 1 hour, 2 days, etc., or select the Any option from the list to provide a From and To date/time for report generation.
Note:
For every user registered with the eG Enterprise system, the administrator can indicate the maximum timeline for which that user can generate a report. Once the maximum timeline is set for a user, then, whenever that user logs into eG Reporter and attempts to generate a report, the Timeline list box in the report page will display options according to the maximum timeline setting of that user. For instance, if a user can generate a report for a maximum period of 3 days only, then 3 days will be the highest option displayed in the Timeline list - i.e., 3 days will be the last option in the fixed Timeline list. Similarly, if the user chooses the Any option from the Timeline list and proceeds to provide a start date and end date for report generation using the From and To specifications, eG Enterprise will first check if the user's Timeline specification conforms to his/her maximum timeline setting. If not, report generation will fail. For instance, for a user who is allowed to generate reports spanning over a maximum period of 3 days only, the difference between the From and To dates should never be over 3 days. If it is, then, upon clicking the Run Report button a message box will appear, prompting the user to change the From and To specification.
-
In addition to the settings discussed above, this report comes with a set of default specifications. These settings are hidden by default. If you do not want to disturb these default settings, then you can proceed to generate the report by clicking the Run Report button soon after you pick one/more components for report generation. However, if you want to view and then alter these settings (if required), click on the
 icon. The default settings will then appear in the MORE OPTIONS drop down window (See Figure 2). The steps below discuss each of these settings and how they can be customized.
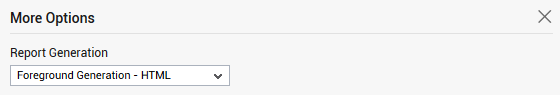
-
In large environments, reports generated using months of data can take a long time to complete. Administrators now have the option of generating reports on-line or in the background. When a report is scheduled for background generation, administrators can proceed with their other monitoring, diagnosis, and reporting tasks, while the eG manager is processing the report. This saves the administrator valuable time. To schedule background processing of a report, you can either select the Background Save - PDF option from the Report Generation list. To process reports in the foreground, select the Foreground Generation - HTML option from this list.
Note:
- The Report Generation list will appear only if the EnableBackgroundReport flag in the [BACKGROUND_PROCESS] section of the eg_report.ini file (in the <EG_INSTALL_DIR>\manager\config directory) is set to Yes.
- The default selection in the Report Generation list will change according to the Timeline specified for the report. If the Timeline set is greater than or equal to the number of days specified against the MinDurationForReport parameter in the [BACKGROUND_PROCESS] section of the eg_report.ini file, then the default selection in the Report Generation list will be Background Save - PDF. On the other hand, if the Timeline set for the report is lesser than the value of the MinDurationForReport parameter, then the default selection in the Report Generation list will be Foreground. This is because, the MinDurationForReport setting governs when reports are to be processed in the background. By default, this parameter is set to 2 weeks - this indicates that by default, reports with a timeline of 2 weeks and above will be processed in the background.
- Click the Done button if any changes were made to the More Options drop down window.
- Finally, click the Run Report button to generate the report.
-
If the Report type is Foreground Generation - HTML, then Figure 3 will appear as soon as you click the Run Report button.
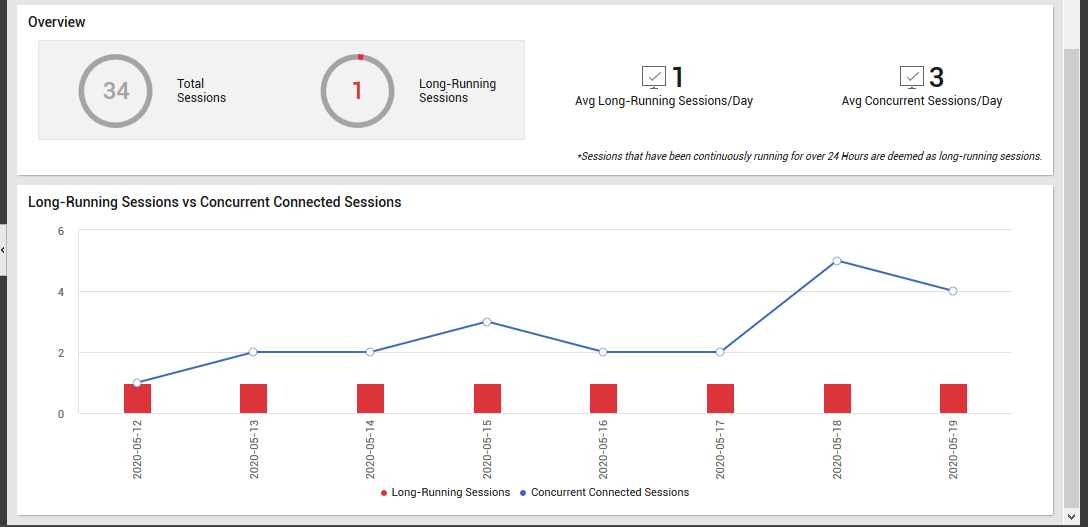
Figure 3 : The generated Long-Running Sessions Report
From the generated report, administrators can figure out the following:
The Overview section provides a detailed insight into the total number of sessions initiated on the chosen server and how many sessions have been running for a duration longer than the a pre-defined time period. This section also reveals the count of average long running sessions per day and the count of average concurrent connected sessions per day.
Note:
Administrators are offered the flexibility to determine if a session should be deemed as a long running session. By default, eG Enterprise deems a sessions as a long -running session if the session exceeds beyond 24 hours. However, if administrators wish to change this default time period and provide a time period of their own, they can do so by following the steps mentioned below:
- Open the eg_report.ini file located in the following location: <EG_INSTALL_DIR>/manager/config.
- Edit the peakTime parameter available under the [SESSION_USAGE_REPORT] section to the value of your choice. By default, this value is set to 24 hours. Note that this value should be set in hours format alone.
The Long-Running Sessions vs Concurrent Connected Sessions graph helps administrators identify the exact date and time on which the long running sessions and concurrent sessions were initiated.