Horizon Connection Brokering - Sessions by Desktop App / Pools Report
Administrators can use this report if they want to historically analyze all Horizon sessions. Comparing session activity by pool, indicates the pools that are receiving the highest workload. Administrators can also analyze session start time metrics by protocol type. This may shed light if session start up slowness is limited to specific protocols. Details of sessions by desktop/app pools provide who accessed the desktop/app, when, using what protocol and host, etc. This information is required for auditing accesses to the Horizon farm.
To generate this report, do the following:
- Follow the menu sequence: REPORTS BY FUNCTION -> Domain-specific Reports -> Virtual Applications / Desktops (
-
Figure 1 then appears. In Figure 1, select a criteria for analysis from the Analyze By list box.
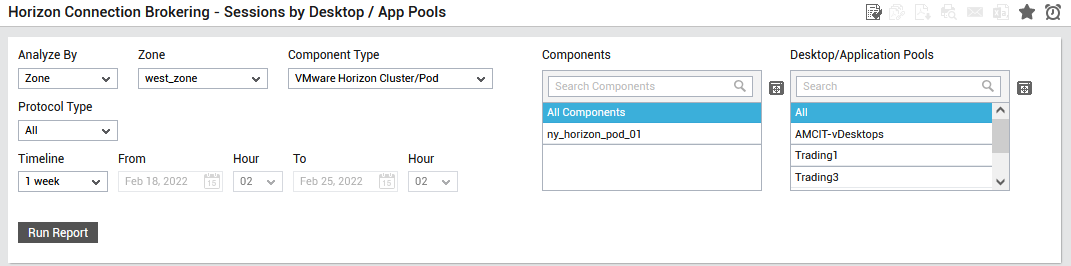
Figure 1 : Specifying the criteria for generating the Sessions by Desktop / App Pools report
-
Using this report, you can analyze the user connection failures noticed on one/more managed components, or those that are part of a zone, service or segment. The options provided by the Analyze By list box are discussed hereunder:
- Component: Select this option to choose the component(s) from across all the managed components in the environment.
- Zone: To generate a report for one/more components that are included in a zone, pick the Zone option. A Zone drop-down list will then appear, from which you would have to select the zone to which the components of interest to you belong. A Sub zone flag also appears. Indicate whether the components present within the sub-zones of the chosen zone are also to be to be considered for report generation, by setting the Sub zone flag to Yes.
- Segment: If you want to generate a report for one/more chosen components that belong to a segment, select the Segment option from Analyze By list box, and then pick the Segment from the drop-down list that appears.
- Service: If you want to generate a report for one/more components involved in the delivery of a service, select the Service option from Analyze By, and then pick the required Service from the drop-down list that appears.
- Choose a Component Type for which the report is to be generated.
- The Components list will now be populated with all the components that are managed in your environment for the chosen component type. If the Components list consists of too many components, then viewing all the components and selecting the ones you need for report generation could require endless scrolling. To avoid this, you can click the
 button next to the Components list. A Components pop up window will then appear using which you can view almost all the components in a single interface and Select the ones to be included in this report.
 - Once the Component Type is chosen, the Desktop / Application Pools list will now be populated with all the desktop/application pools that were created on the chosen server (component). By default, this report will be generated for all desktop / application pools. To this effect, AIl option will be chosen from this list. If you wish to choose individual desktop pools, then you can do so. If the Desktop / Application Pools list consists of too many desktop pools, then viewing all the pools and selecting the ones you need for report generation could require endless scrolling. To avoid this, you can click the button next to the Desktop / Application Pools list. A Desktop / Application Pools pop up window will then appear using which you can view almost all the desktop pools in a single interface and Select the ones to be included in this report.
- By default, All option will be chosen from the Protocol Type list which implies that the report will be generated for all the sessions initiated irrespective of the protocol used to initiate the session. For example, if you wish to generate the report for the sessions initiated through blast protocol alone, then, you can choose Blast from this list.
-
Then, specify the Timeline for generating this report. You can either provide a fixed time line such as 1 hour, 2 days, etc., or select the Any option from the list to provide a From and To date/time for report generation.
Note:
For every user registered with the eG Enterprise system, the administrator can indicate the maximum timeline for which that user can generate a report. Once the maximum timeline is set for a user, then, whenever that user logs into eG Reporter and attempts to generate a report, the Timeline list box in the report page will display options according to the maximum timeline setting of that user. For instance, if a user can generate a report for a maximum period of 3 days only, then 3 days will be the highest option displayed in the Timeline list - i.e., 3 days will be the last option in the fixed Timeline list. Similarly, if the user chooses the Any option from the Timeline list and proceeds to provide a start date and end date for report generation using the From and To specifications, eG Enterprise will first check if the user's Timeline specification conforms to his/her maximum timeline setting. If not, report generation will fail. For instance, for a user who is allowed to generate reports spanning over a maximum period of 3 days only, the difference between the From and To dates should never be over 3 days. If it is, then, upon clicking the Run Report button a message box will appear, prompting the user to change the From and To specification.
-
In addition to the settings discussed above, this report comes with a set of default specifications. These settings are hidden by default. If you do not want to disturb these default settings, then you can proceed to generate the report by clicking the Run Report button soon after you pick one/more components for report generation. However, if you want to view and then alter these settings (if required), click on the
 icon. The default settings will then appear in the MORE OPTIONS drop down window (See Figure 2). The steps below discuss each of these settings and how they can be customized.
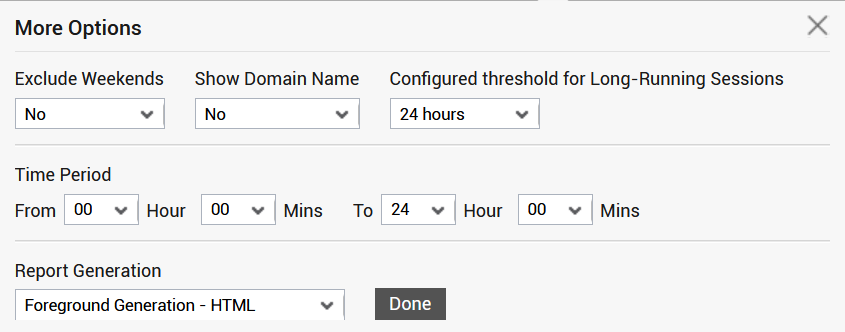
-
If the timeline specified for the report needs to exclude the data collected during the Weekends, then set Exclude weekends to Yes. If not, select No.
Note:
By default, the weekend constitutes Saturday and Sunday. To override this default setting, do the following:
- Edit the eg_report.ini file in the <EG_INSTALL_DIR>\manager\config directory.
- In the [EXCLUDE_WEEKEND] section of the file, the Days parameter is set to Saturday,Sunday by default. You can modify this by setting the Days parameter to a comma-separated list of other days of the week - say Friday,Saturday.
- Save the file after making the required changes.
- By default, No option is chosen from the Show Domain Name list indicating that the generated report will list the name of the users initiating the sessions in the target environment. If you wish this report to specify the domain to which the users belong to, then, you can set this flag to Yes.
- By default, the Configured threshold for Long-Running Sessions is set to 24 hours indicating that any session that has not ended within 24 hours are deemed to be a long running session. However, according to the needs of your environment, you can set this value to as low as 4 hours and as long as 2 days.
-
Next, indicate the report Time period.
Note:
By default, the Time period is set to 24 hours. Accordingly, the From and To parameters in the [timeframe] section of the eg_report.ini file (in the <eg_install_dir>\manager\config directory) are set to 00:00 and 24:00 respectively. If need be, you can override this default setting by configuring a different timeframe against the From and/or To parameters.
-
In large environments, reports generated using months of data can take a long time to complete. Administrators now have the option of generating reports on-line or in the background. When a report is scheduled for background generation, administrators can proceed with their other monitoring, diagnosis, and reporting tasks, while the eG manager is processing the report. This saves the administrator valuable time. To schedule background processing of a report, you can either select the Background Save - PDF option from the Report Generation list. To process reports in the foreground, select the Foreground Generation - HTML option from this list.
Note:
- The Report Generation list will appear only if the EnableBackgroundReport flag in the [BACKGROUND_PROCESS] section of the eg_report.ini file (in the <EG_INSTALL_DIR>\manager\config directory) is set to Yes.
- The default selection in the Report Generation list will change according to the Timeline specified for the report. If the Timeline set is greater than or equal to the number of days specified against the MinDurationForReport parameter in the [BACKGROUND_PROCESS] section of the eg_report.ini file, then the default selection in the Report Generation list will be Background Save - PDF. On the other hand, if the Timeline set for the report is lesser than the value of the MinDurationForReport parameter, then the default selection in the Report Generation list will be Foreground. This is because, the MinDurationForReport setting governs when reports are to be processed in the background. By default, this parameter is set to 2 weeks - this indicates that by default, reports with a timeline of 2 weeks and above will be processed in the background.
- Click the Done button if any changes were made to the More Options drop down window.
- Finally, click the Run Report button to generate the report.
-
If the Report type is Foreground Generation - HTML, then Figure 3 will appear as soon as you click the Run Report button.
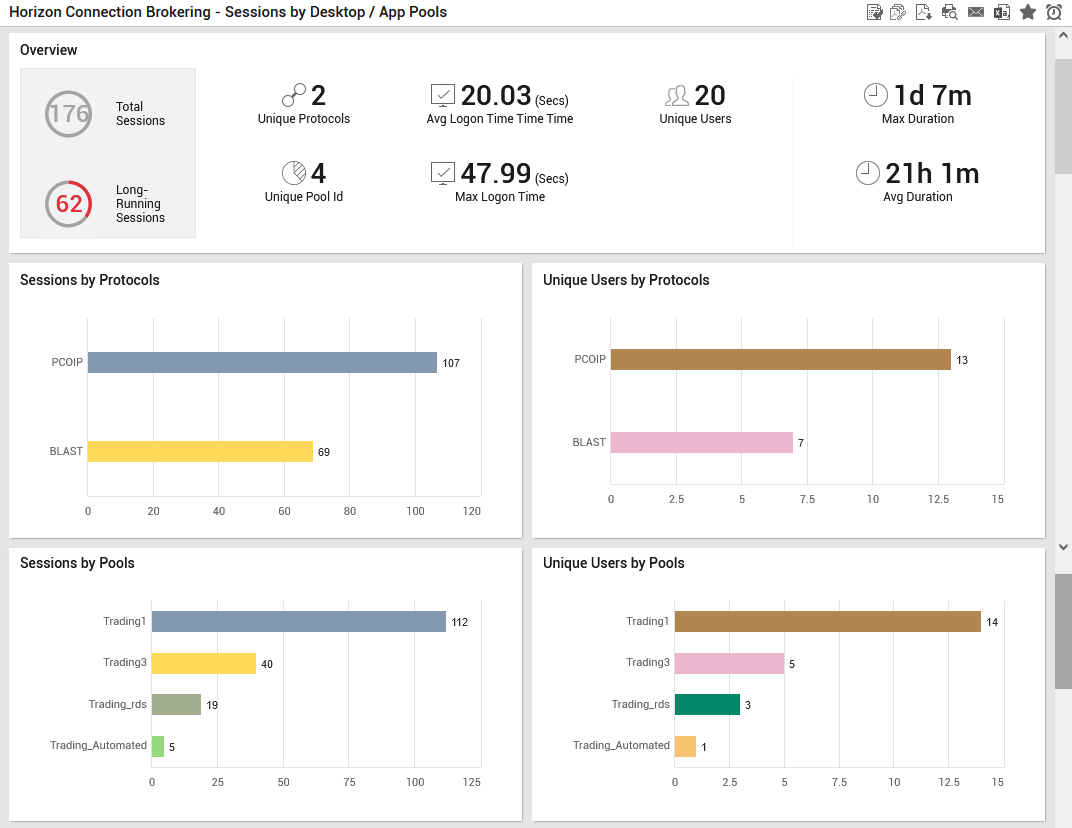
Figure 3 : The generated Sessions by Desktop / App Pools Report
-
Figure 3 reveals the following:
-
The Overview section reveals an overview of the sessions established by the chosen component in the target environment. By merely looking at this section, administrators can figure out the sessions that are running for a longer duration, unique protocols through which sessions are established, unique users accessing the target environment by establishing sessions, the average duration of a session etc.
-
The Sessions by Protocol bar graph reveals the count of sessions established in the target environment through different protocols. This graph greatly helps administrators identify the protocol through which maximum number of sessions were established.
-
The Unique Users by Protocol bar graph reveals the number of unique users who have established sessions thorough different protocols. This graph greatly helps administrators identify the protocol using which maximum number of users established the sessions.
-
The Session by Pools bar graph reveals the number of sessions established in the target environment through unique desktop / application pools. By merely looking at this graph, administrators can figure out the desktop / application pool that is over-utilized to establish the sessions.
-
The Unique Users by Pools bar graph reveals the number of users (belonging to a desktop / application pool) who have established sessions. Using this graph, administrators can figure out the desktop / application pool that is most commonly used by the users to establish sessions.
-
-
The Session Usage By Start Time section (see Figure 4) reveals a trend graph using which administrators can figure out the average session usage of the users based on the start time over a chosen time period. This graph helps in understanding the exact time/date on which high start time was noticed during sessions.
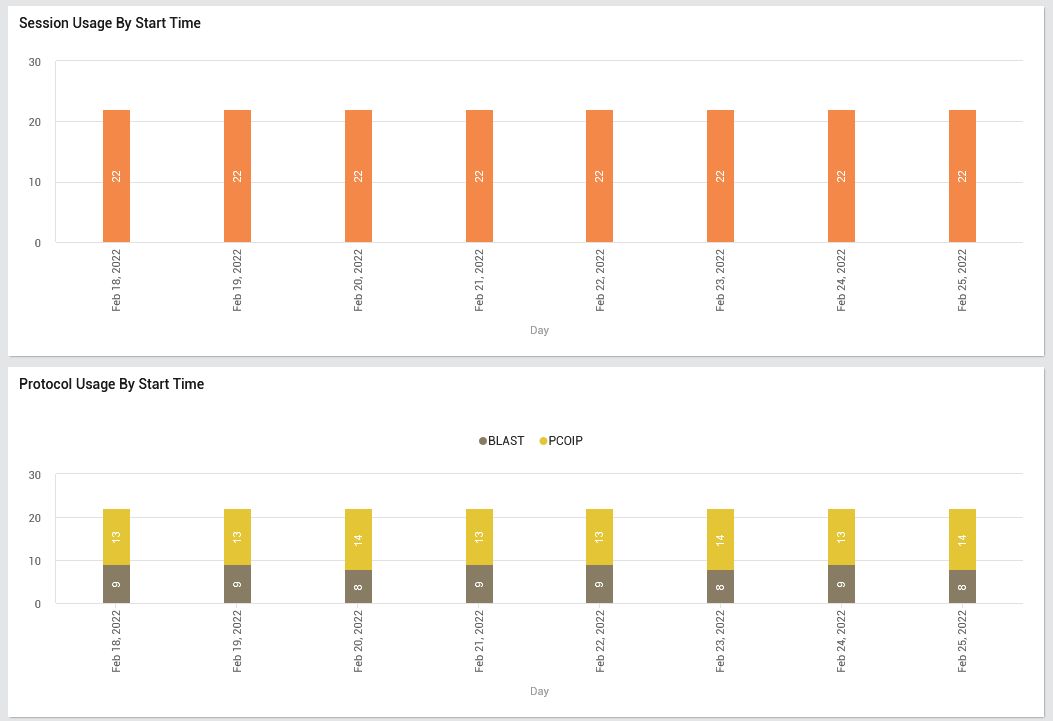
Figure 4 : The Session Usage By Start Time and Protocol Usage By Start Time sections
The Protocol Usage By Start Time section (see Figure 4) reveals a graph using which you can figure out the number of sessions that were established using different protocols over a chosen period of time. This will help administrators identify the exact day on which maximum number of sessions were established through different protocols.
-
The Sessions Details section as shown in Figure 5 reveals a detailed historical analysis of the sessions established during the chosen time period. Using this section, administrators can figure out the user who has established the session, the protocol used for establishing the session, long running sessions, logon duration etc.
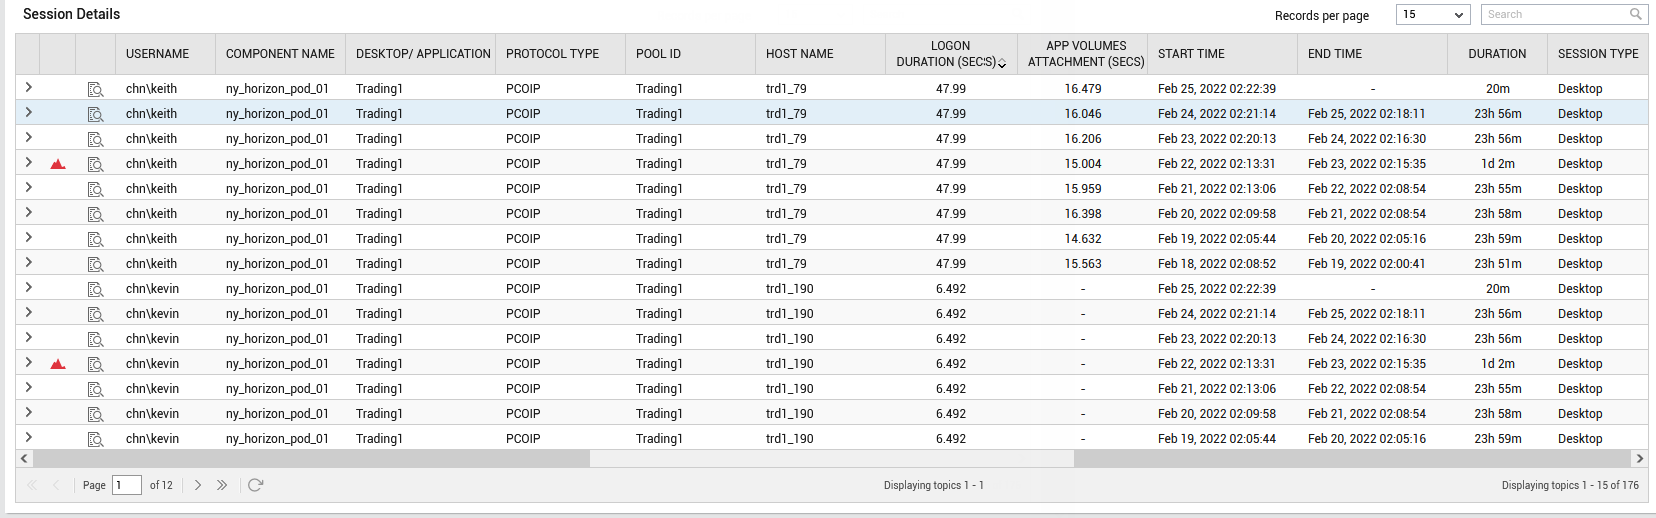
Figure 5 : The Session Details section
The
 icon helps administrators to quickly identify the sessions that were running for a longer duration.
 -
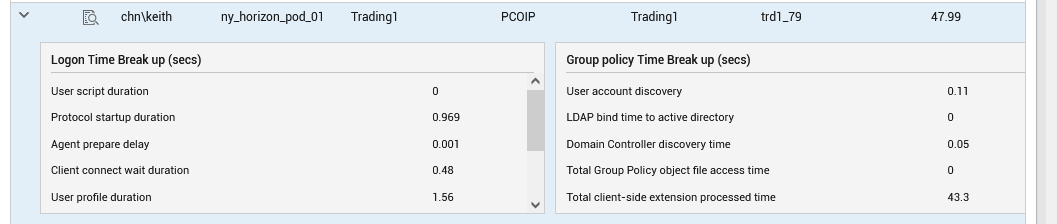
Expanding the > arrow against a row in Figure 5 reveals Figure 6. Using Figure 6, administrators can figure out details of Logon time break up and Group policy time break up while a session was established by the user. This will help administrators identify the exact activity duration that contributed to a delayed logon and delayed processing of group policy.
-
Clicking the
 icon against a chosen user session will lead you to Figure 7 using which you can view a graphical representation of the performance of certain key session related metrics such as login time, applications accessed, active/idle time, session start-up details, resource usage during the session, etc.
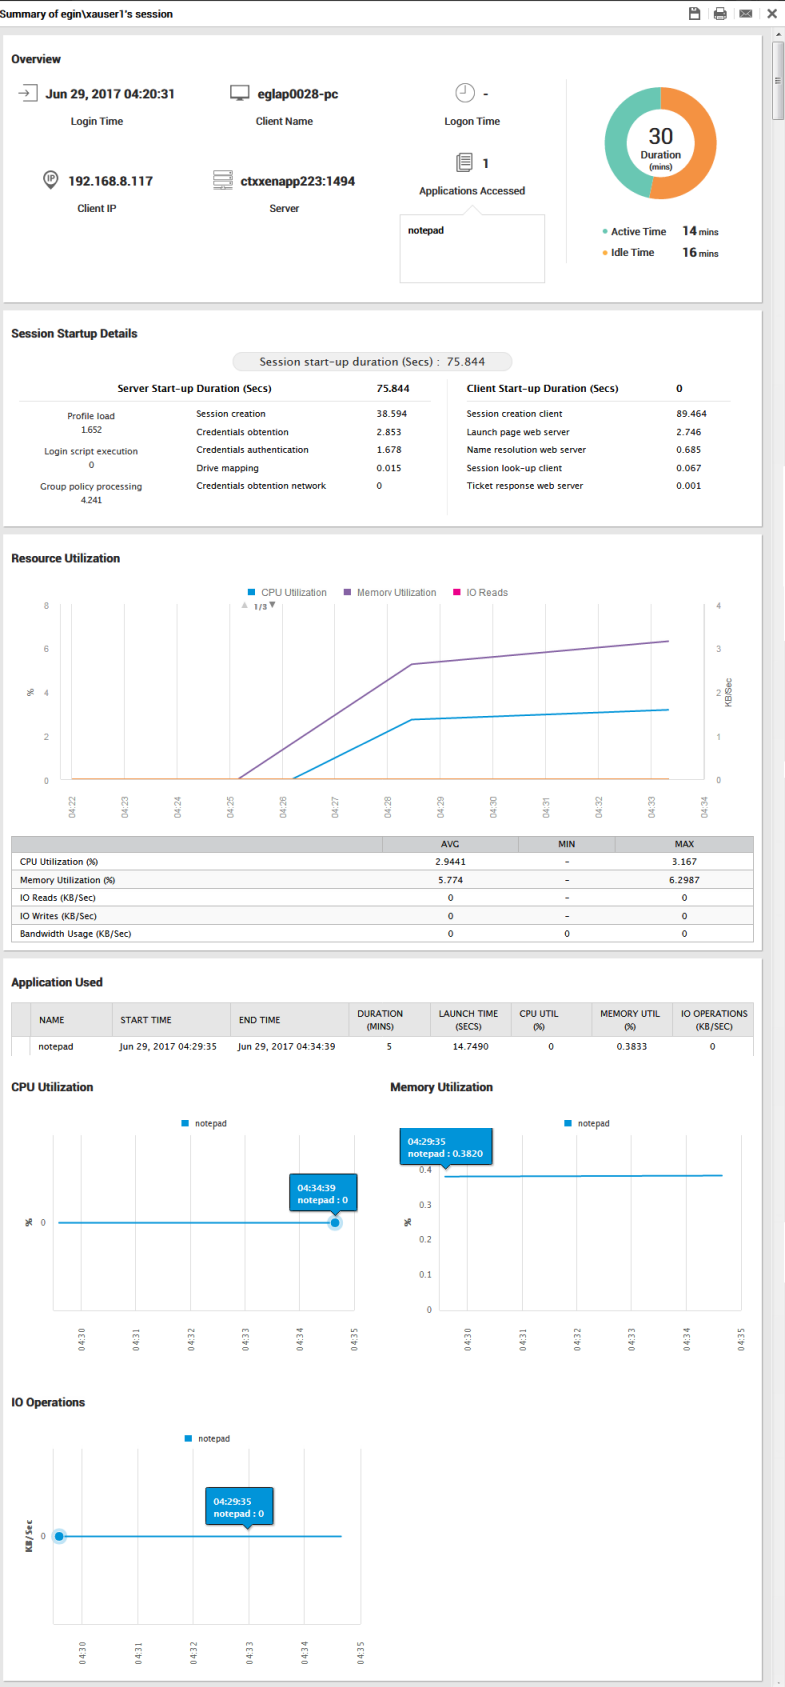
Figure 7 : The graphical representation of key session related metrics
Besides being visually appealing, the graphics also help rapidly detect problem areas.