Hypervisors - Capacity Planning Report
The Hypervisors - Capacity Planning report provides deep insights into the resource utilization of the hosts in the physical server farm and enables the administrators to actually compare the resource utilization of all the hosts in the physical server farm. Apart from this, the report also helps you to figure out the following:
- The resource hungry hosts in the physical server farm;
- The root cause to the paucity of resources on the hosts can be diagnosed by quickly drilling down to the VMs operating on the hosts – Is it due to the resource hungry processes on the hosts or the resource intensive VMs or because of the over allocation of resources to the VMs?;
Based on this report, you can plan the future migration activity of the VMs by identifying those VMs that consume high resources of a host. This way, you can release the resources of a resource intensive host. Apart from this, you can also identify whether these hosts are capable of accommodating additional VMs to them? Are there enough resources in the hosts to support those additional VMs or should the capacity of the hosts need to be enhanced to handle the additional load of the VMs either at present or in the future?
To generate the Hypervisors - Capacity Planning report, do the following:
- Follow the menu sequence: REPORTS BY FUNCTION -> Domain-specific Reports -> Virtualization -> Hypervisors -> Capacity Planning in the eG Reporter interface.
-
Figure 1 appears. First, select a criterion for analysis from the Analyze by list box. Using this report, you can analyze the capacity of the hosts and virtual machines hosted on independent virtual servers or those that are part of a segment, service, or a zone. The options provided by the Analyze by list box are discussed hereunder:
- Component:Select this option to choose the component(s) from across all the managed virtualized components in the environment. For instance, for a report on the capacity of VMs on all the managed vSphere/ESX hosts in the environment, select VMware vSphere ESX from the Component Type list, select Component from the Analyze by list, and then select all the virtual hosts listed in the Component list of Figure 1. If the Component list consists of too many components, then viewing all the components and selecting the ones you need for report generation could require endless scrolling.To avoid this, you can click the
 icon next to the Componentlist. The COMPONENTSpop up window will then appear using which you can view almost all the components in a single interface and select the ones for which the report is to be generated.
 - Service: Select this option to generate the report for all virtual servers that are involved in the delivery of a business service. Then, select a Service.
- Segment: Choose this option if the virtual servers to be evaluated are configured on the virtual hosts that are part of a segment. Then, pick a Segment for analysis.
-
Zone: Pick this option for a report on the status of virtual servers managed on all virtual hosts that are included in a zone. Then, choose a Zone. Also, indicate whether the virtual servers present within the sub-zones of the chosen zone are also to be considered for report generation, by selecting an option from the Include Subzone list.
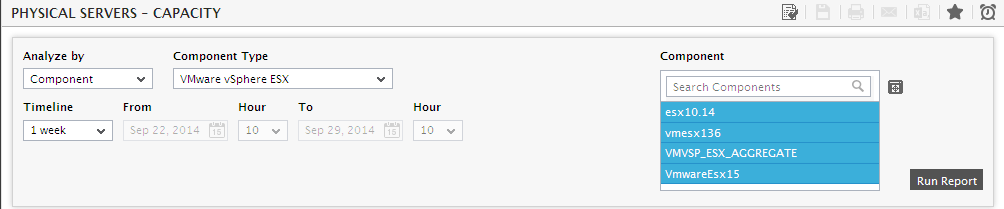
Figure 1 : Selecting the criteria for the Hypervisors - Capacity Planning report
- Component:Select this option to choose the component(s) from across all the managed virtualized components in the environment. For instance, for a report on the capacity of VMs on all the managed vSphere/ESX hosts in the environment, select VMware vSphere ESX from the Component Type list, select Component from the Analyze by list, and then select all the virtual hosts listed in the Component list of Figure 1. If the Component list consists of too many components, then viewing all the components and selecting the ones you need for report generation could require endless scrolling.To avoid this, you can click the
- Next, from the Component Type list, pick the virtualized component-type for which the report is to be generated. By default, all managed virtualization platforms will be listed here.
- Based on the criterion chosen from the Analyze by list, the Component list will be populated. Select one/more of the listed components to generate a report. If the Component list consists of too many components, then viewing all the components and selecting the ones you need for report generation could require endless scrolling. To avoid this, you can click the icon next to the Component list. The COMPONENTS pop up window will then appear using which you can view almost all the components in a single interface and select the ones for which the report is to be generated.
-
Next, using the Timeline option, specify the period to which this report should pertain.
Note:
For every user registered with the eG Enterprise system, the administrator can indicate the maximum timeline for which that user can generate a report. Once the maximum timeline is set for a user, then, whenever that user logs into eG Reporter and attempts to generate a report, the Timeline list box in the report page will display options according to the maximum timeline setting of that user. For instance, if a user can generate a report for a maximum period of 3 days only, then 3 days will be the highest option displayed in the Timeline list - i.e., 3 days will be the last option in the fixed Timeline list. Similarly, if the user chooses the Any option from the Timeline list and proceeds to provide a start date and end date for report generation using the From and To specifications, eG Enterprise will first check if the user's Timeline specification conforms to his/her maximum timeline setting. If not, report generation will fail. For instance, for a user who is allowed to generate reports spanning over a maximum period of 3 days only, the difference between the From and To dates should never be over 3 days. If it is, then, upon clicking the Run Report button a message box will appear, prompting the user to change the From and To specification.
-
In addition to the settings discussed above, this report comes with a set of default specifications. These settings are hidden by default. If you do not want to disturb these default settings, then you can proceed to generate the report by clicking the Run Report button soon after you pick an option from the Component list. However, if you want to view and then alter these settings (if required), click on the
 button. The default settings will then appear in the MORE OPTIONS drop down window (see ). The steps below discuss each of these settings and how they can be customized.
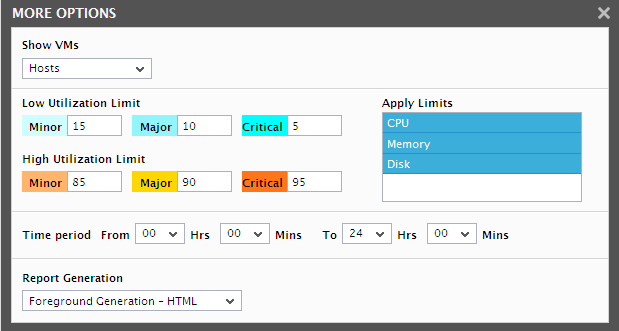
Figure 2 : The default settings for generating a Physical Servers – Capacity Planning report
- Pick an option from the Show VMs list box to view the current capacity of the hosts and individual VMs that are hosted in the virtualized environment. By default, the Hosts option will appear in this list box indicating that the capacity of the hosts in the virtual environment can be viewed at a single glance. In order to view the current capacity of individual VMs, select the VMs option from this list. Choose the Hosts & VMs option to clearly understand the current capacity of the hosts and the corresponding VMs at a single glance.
- eG Enterprise System offers the flexibility of allowing the administrators to view the VMs/Hosts that consume high/low resources from the generated report at a single glance. This can be achieved by providing the lower/higher threshold limits of your choice i.e., providing the Minor/Major/Critical values in the appropriate colored text boxes against the Low Utilization Limit and High Utilization Limit options. Doing so, whenever the VMs/Hosts violate the specified threshold values, the current capacity of that particular VM/Host will be highlighted with the corresponding color of the specified text box in the generated report. This way, you can easily identify the VMs/Hosts that consume high/low resources in your environment. By default, the values specified against the Minor/Major/Critical text boxes of the Low Utilization Limit and High Utilization Limit options will be 5/10/15 and 85/90/95 respectively.
- Choose an option from the Apply Limits list box so that the values that fall in the range mentioned in the Low Utilization Limit and High Utilization Limit options will be highlighted in the generated report. By default, all the three options (CPU/Memory/Disk) will be selected indicating that the administrators can view the resource intensive/resource hungry VMs/Hosts based on their CPU/Disk/Memory utilization.
- Next, indicate the report Timeperiod.
-
In large environments, reports generated using months of data can take a long time to complete. Administrators now have the option of generating reports on-line or in the background. When a report is scheduled for background generation, administrators can proceed with their other monitoring, diagnosis, and reporting tasks, while the eG manager is processing the report. This saves the administrator valuable time. To schedule background processing of a report, you can either select the Background Save - PDF option or the Background Save - CSV option from the Report Generation list. In this case, a Report Name text box will appear, where you would have to provide the name with which the report is to be saved in the background. To process reports in the foreground, select the Foreground Generation - HTML option from this list.
Note:
- The default selection in the Report Generation list will change according to the Timeline specified for the report. If the Timeline set is greater than or equal to the number of days specified against the MinDurationForReport parameter in the [BACKGROUND_PROCESS] section of the eg_report.ini file, then the default selection in the Report Generation list will be Background Save - PDF. On the other hand, if the Timeline set for the report is lesser than the value of the MinDurationForReport parameter, then the default selection in the Report Generation list will be Foreground. This is because, the MinDurationForReport setting governs when reports are to be processed in the background. By default, this parameter is set to 2 weeks - this indicates that by default, reports with a timeline of 2 weeks and above will be processed in the background.
- The Report Generation list will appear only if the EnableBackgroundReport flag in the [BACKGROUND_PROCESS] section of the eg_report.ini file (in the [EG_INSTALL_DIR]\manager\config directory) is set to Yes.
-
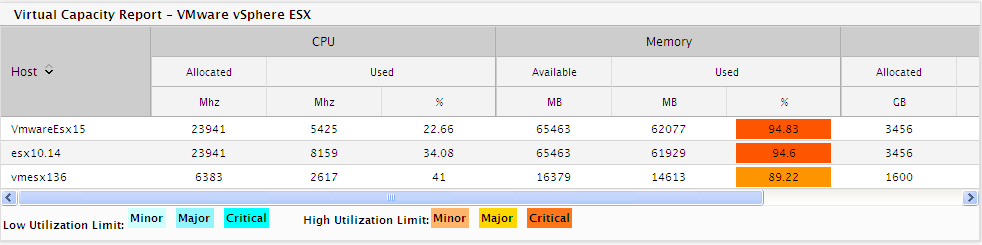
Clicking on the Run Report button in Figure 1 will reveal the Physical Servers - Capacity report as in Figure 3.
-
Figure 3 shows the Physical Servers - Capacity Planning report that is generated when the Hosts option is chosen from the Show VMs list box. Using this report, you can easily figure out the actual resource usage of the hosts and identify if there is any potential bottleneck on the hosts. The generated report will list the CPU, Memory and disk usage of the host. From the generated report, you can easily identify the following:
- The allocated CPU and the CPU that is currently utilized by the hosts. The actual value in Megahertz and the percentage of CPU utilized will be indicated in separate columns. (see Figure 3).
- The memory that is currently available in the host and the memory that is currently in use by the virtual host. The actual memory usage in MB and the percentage of memory utilized will be represented in separate columns.
- The disk space that is currently allocated to each host and the disk space that is currently in use by the host. The actual disk space that is utilized (in GB) and the percentage of disk space utilization will be represented in separate columns.
By default, the hosts will be sorted in the descending order. If you wish to sort the hosts in the descending order, then click on the down arrow adjacent to the Host in the generated report. Likewise, you can sort the report based on any column. To do so, just click on the measurement units displayed in each column of the report. The column will now be sorted in ascending order.
-
If you have selected the VMs option from the Show VMs list box, then the report (see Figure 4) will be generated for all the VMs that are hosted in the target environment. The generated report will list all the VMs along with the host that is hosting the VMs. The generated report will consist of the details as discussed in step 13.
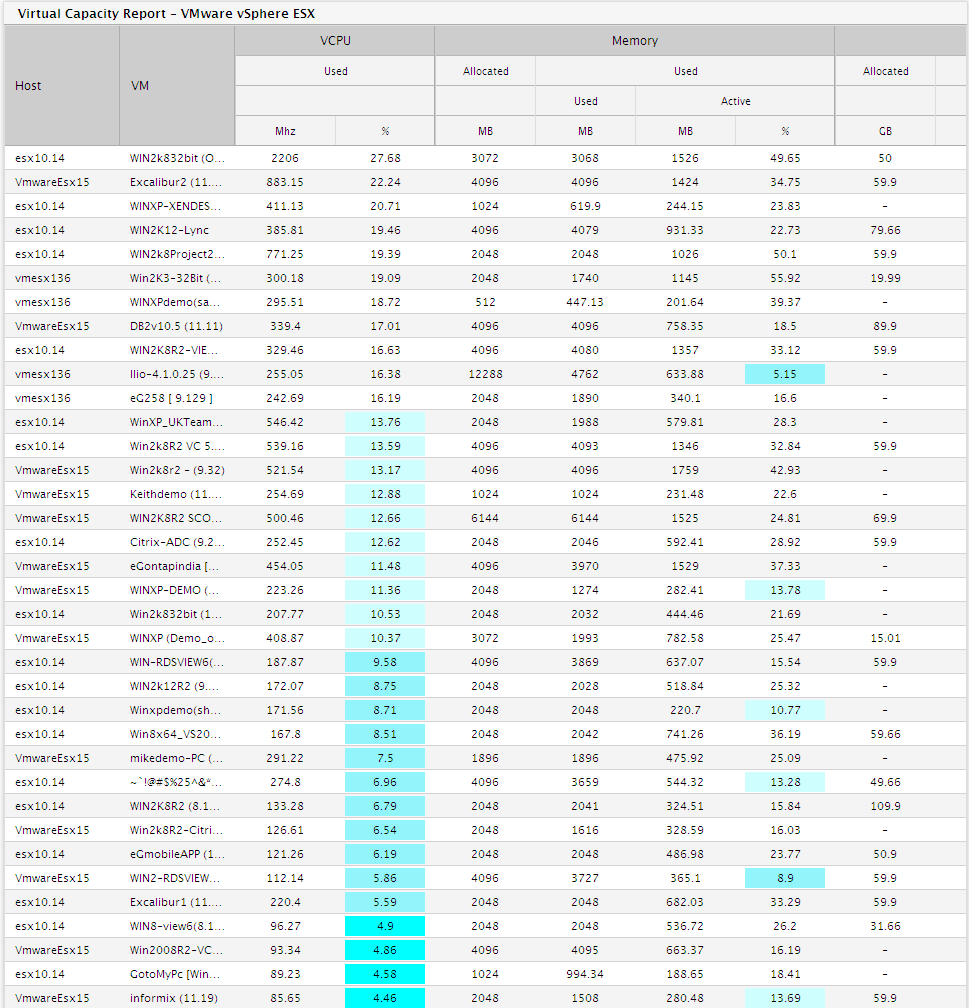
Figure 4 : The Physical Servers - Capacity Planning report that is generated when the VMs option is selected
-
If the Hosts & VMs option is chosen from the Show Criteria list box, then the report will be generated as in Figure 5. The generated report will be a combination of the report that is generated when the Hosts and the VMs option are selected individually. In this report, you will be able to view the capacity of each individual host and the VMs that are hosted through that host.
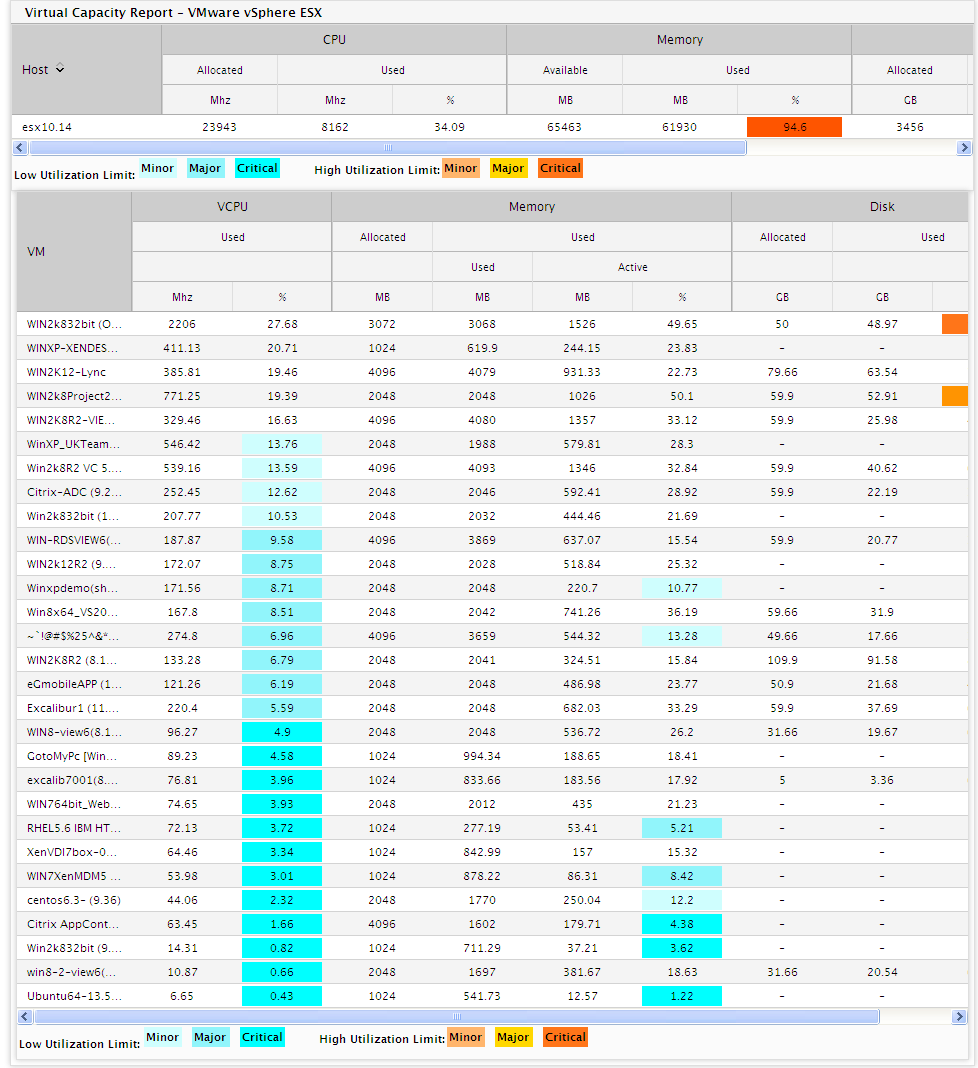
Figure 5 : The Physical Servers - Capacity Planning report that is generated when the Hosts & VMs option is selected