Hypervisors - Resource Analytics Report
This report provides deep insights into the resource utilization of the physical servers on a day-to-day basis as well as on a monthly basis. Using this report, the administrators can easily figure out the following:
- How well the CPU of the physical server has been utilized over a period of time? Is it under-utilized or over-utilized?
- Has the maximum CPU utilization limit reached?
- How well the memory of the physical server has been utilized? Are adequate memory resources available?
- What is the network usage of the physical server? Is the network available to the physical server?
- How well the disk of the physical server is utilized? Is it adequately sized or if additional disk is required for the storage activity of the physical server?
To generate the Hypervisors - Resource Analytics report, do the following:
- Follow the menu sequence: REPORTS BY FUNCTION -> Domain-specific Reports -> Virtualization -> Hypervisors -> Resource Analytics.
-
Figure 1 now appears. First, select a criterion for analysis from the Report For list box. Using this report, you can view the resource utilization of independent physical servers or those that are part of a segment, service, or a zone. The options provided by the Report For list box are discussed hereunder:
- Component:Select this option to choose the component(s) from across all the managed components in the environment. For instance, for a report on the resource utilization of the managed vSphere/ESX hosts in the environment, select VMware vSphere ESX from the Component Type list, select Component from the Report Forlist, and then select all the virtual hosts listed in the Component list of Figure 1. If the Component list consists of too many components, then viewing all the components and selecting the ones you need for report generation could require endless scrolling. To avoid this, you can click the
 button next to the Component list. The COMPONENTS pop up window will then appear using which you can view almost all the components in a single interface and select the ones for which the report is to be generated.
 - Service: Select this option to generate the report for all components that are involved in the delivery of a business service. Then, select a Service.
- Segment: Choose this option if the virtual hosts to be evaluated are configured on the virtual hosts that are part of a segment. Then, pick a Segment for analysis.
-
Zone: Pick this option for a report on the status of the components managed on all virtual hosts that are included in a zone. Then, choose a Zone. Also, indicate whether the virtual servers present within the sub-zones of the chosen zone are also to be considered for report generation, by selecting an option from the Include Subzoneslist.
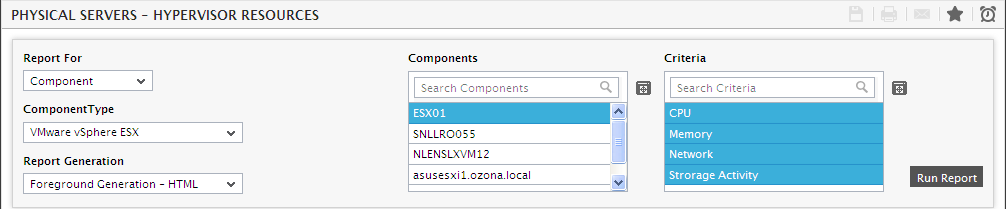
Figure 1 : Selecting the criteria for the Hypervisors - Resource Analytics report
- Component:Select this option to choose the component(s) from across all the managed components in the environment. For instance, for a report on the resource utilization of the managed vSphere/ESX hosts in the environment, select VMware vSphere ESX from the Component Type list, select Component from the Report Forlist, and then select all the virtual hosts listed in the Component list of Figure 1. If the Component list consists of too many components, then viewing all the components and selecting the ones you need for report generation could require endless scrolling. To avoid this, you can click the
- Next, from the Component Type list, pick the component type for which the report is to be generated. By default, all managed component types in your environment will be listed here.
- Based on the criterion chosen from the Report For list, the Components list will be populated. Select one/more of the listed components to generate a report. If the Components list consists of too many components, then viewing all the components and selecting the ones you need for report generation could require endless scrolling. To avoid this, you can click the icon next to the Components list. The COMPONENTS pop up window will then appear using which you can view almost all the components in a single interface and select the ones for which the report is to be generated.
- Pick an option from the Criteria list box for which the report is to be generated. By default, this report enables you to figure out the CPU utilization, Memory utilization and Network usage of the chosen component. If the chosen component is VMware vSphere ESX as in Figure 1, then the report will be generated for the storage activity of the component as well. Likewise, if the chosen component is Citrix XenServer VDI, then the report will be generated for the disk activity of the component. By default, all the options i.e., CPU, Memory, Network listed in this list box will be selected. If you wish to view the report for a single Criteria of your choice, you may just select that criteria alone from this list box.
-
In large environments, reports generated using months of data can take a long time to complete. Administrators now have the option of generating reports on-line or in the background. When a report is scheduled for background generation, administrators can proceed with their other monitoring, diagnosis, and reporting tasks, while the eG manager is processing the report. This saves the administrator valuable time. To schedule background processing of a report, select the Background Save - PDF option from the Report Generation list. In this case, a Report Name text box will appear, where you would have to provide the name with which the report is to be saved in the background. To process reports in the foreground, select the Foreground Generation - HTML option from this list.
Note:
- The Report Generation list will appear only if the EnableBackgroundReport flag in the [BACKGROUND_PROCESS] section of the eg_report.ini file (in the [EG_INSTALL_DIR]\manager\config directory) is set to Yes.
- The default selection in the Report Generation list will change according to the Timeline specified for the report. If the Timeline set is greater than or equal to the number of days specified against the MinDurationForReport parameter in the [BACKGROUND_PROCESS] section of the eg_report.ini file, then the default selection in the Report Generation list will be Background. On the other hand, if the Timeline set for the report is lesser than the value of the MinDurationForReport parameter, then the default selection in the Report Generation list will be Foreground. This is because, the MinDurationForReport setting governs when reports are to be processed in the background. By default, this parameter is set to 2 weeks - this indicates that by default, reports with a timeline of 2 weeks and above will be processed in the background.
-
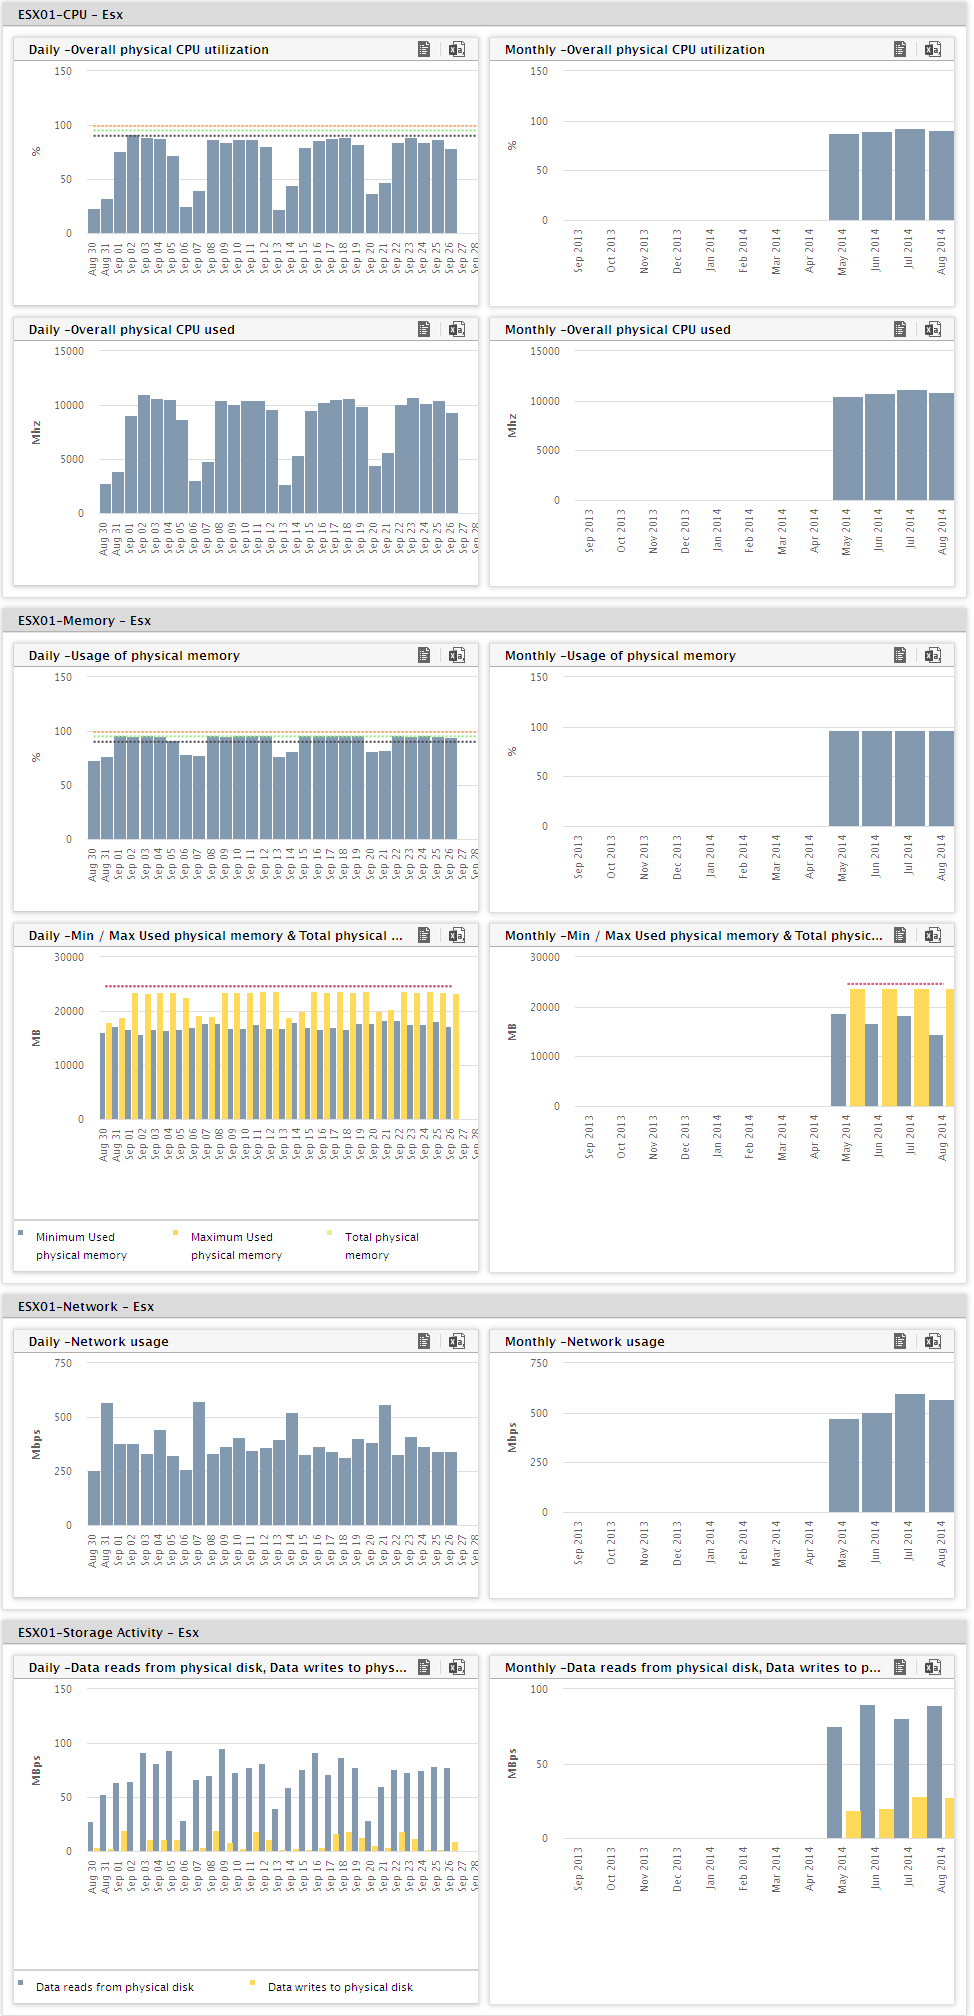
Finally, click the Run Report button. Figure 2 will now appear.
-
Figure 2 shows a graphical report on the utilization of various resources of the chosen component. This report provides you with the resource utilization of the component on a day-to-day basis and on a monthly basis. Using this report, you can easily identify, on which particular day/month the resource has been over-utilized/under-utilized. In addition to this, you can also view the thresholds set for the measure from the graph. Suppose if the Critical/Major/Minor thresholds are set for the Overall physical CPU utilization measure, then the threshold limits will be displayed as colored dots for the measure in both the daily report and the monthly report. When you mouse over the colored dots on a daily graph report, you will get to see the exact date and threshold for that measure on that day. Likewise, when you mouse over the threshold limit on a monthly graph, you will view the average threshold for that measure during the chosen month. In places where thresholds are not applicable, say for e.g., the Minimum/Maximum Used physical memory graph, the total physical memory of the component is specified in the graph as against the threshold values.
Note:
By default, the number of days and number of months for which the graph is generated is 30 and 12 respectively. To override this default setting, do the following:
- Edit the eg_report.ini file in the <EG_INSTALL_DIR>\manager\config directory.
- To override the daily report graph, specify a number of your choice against the TimePeriodforDays parameter in the [PHYSICAL_SERVERS_RESOURCES] section of this file. By default, this parameter will hold the value 30.
- To override the monthly report graph, specify a number of your choice against the TimePeriodforMonths parameter in the [PHYSICAL_SERVERS_RESOURCES] section of this file. By default, this parameter will hold the value 12.
- Save the eg_report.ini file.
-
Apart from the graphical report, you can also view the data report for each individual graph by clicking on the
 icon present above each graph as in Figure 2. Upon doing so, a data report will appear for that chosen graph. Figure 3 shows the data report of the Daily – Overall physical CPU utilization graph. In this data table, you can view the physical CPU utilization of the chosen component on a daily basis and the corresponding threshold limits that were set for that measure.
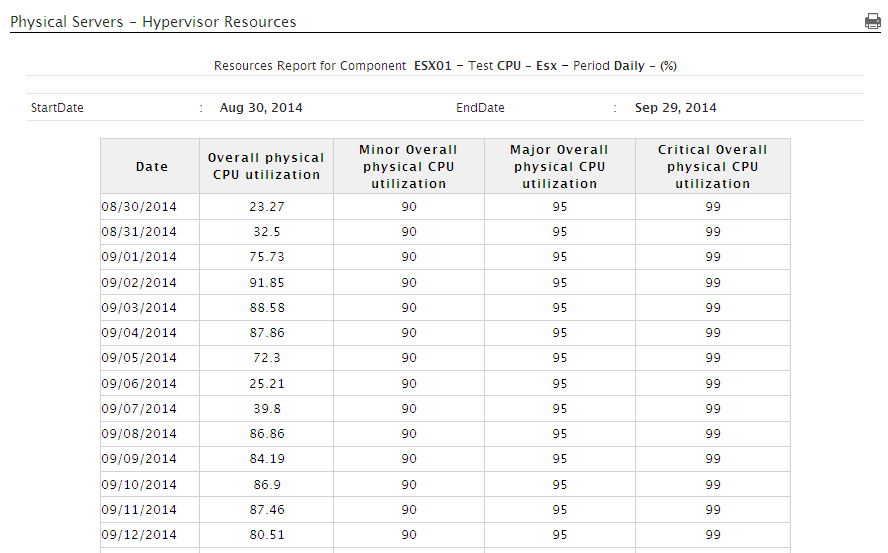
Figure 3 : Data report of the Overall physical CPU utilization measure on a daily basis
Note:
While the actual Network usage of the component is represented for the Components types like VMware vSphere Esx, VMware vSphere VDI, Hyper – V, Hyper – V VDI, Oracle VDI etc, the Network usage for the Citrix Xenserver component type is represented as a combination of I/O Read rate and I/O Write rate.