JVM - CPU Analysis Report
Use the JVM - CPU Analysis report to historically analyse the CPU utilization of the thread types. The thread type that consumed maximum CPU is identified and administrators are alerted to that thread type through the recommendations offered by eG Enterprise.
To generate the JVM - CPU Analysis report, do the following:
- Select the CPU Analysis option by following the menu sequence: REPORTS BY FUNCTION -> Domain-specific Reports -> Web Application Monitoring -> Java.
-
Figure 1 will then appear.
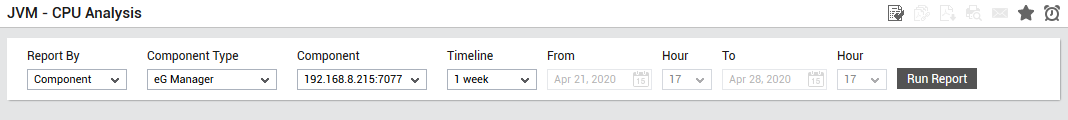
Figure 1 : Specifying the criteria for generating the JVM - CPU Analysis report
-
To ease the pain involved in choosing the components for report generation, eG Enterprise provides a Report By list. The options provided by the Report By list box are discussed hereunder:
- Zone: By default, the Zone option is chosen from the Report By list - this indicates that by default, the list will display all the managed components in the chosen zone. Select the zone to which the components of interest to you belong from the Zone drop-down list.
- Component: Select this option to generate a report on the components that are managed in the target environment.
- Service: Select this option if the components for which a report is to be generated are involved in the delivery of a business service. Then, select a Service.
- Segment: Choose this option if the components to be evaluated are part of a segment. Then, pick a Segment for analysis.
- Next, choose a Component Type. This list lists all the components that are executing on JVM, by default. The Components list is then populated with the components pertaining to the chosen Component Type. If the Components list consists of too many components, then viewing all the components and selecting the ones you need for report generation could require endless scrolling. To avoid this, you can click the
 button next to the Components list. The COMPONENTS pop up window will then appear using which you can view almost all the components in a single interface and Select the ones for which the report is to be generated. You can narrow your search further by using the Search text box. Specify the whole/part of the component name to search for in this text box, and click the
  icon next to it.
 -
Then, specify the Timeline for generating the report. You can either provide a fixed time line such as 1 hour, 2 days, etc., or select the Any option from the list to provide a From and To date/time for report generation.
Note:
For every user registered with the eG Enterprise system, the administrator can indicate the maximum timeline for which that user can generate a report. Once the maximum timeline is set for a user, then, whenever that user logs into eG Reporter and attempts to generate a report, the Timeline list box in the report page will display options according to the maximum timeline setting of that user. For instance, if a user can generate a report for a maximum period of 3 days only, then 3 days will be the highest option displayed in the Timeline list - i.e., 3 days will be the last option in the fixed Timeline list. Similarly, if the user chooses the Any option from the Timeline list and proceeds to provide a start date and end date for report generation using the From and To specifications, eG Enterprise will first check if the user's Timeline specification conforms to his/her maximum timeline setting. If not, report generation will fail. For instance, for a user who is allowed to generate reports spanning over a maximum period of 3 days only, the difference between the From and To dates should never be over 3 days. If it is, then, upon clicking the Run Report button a message box will appear, prompting the user to change the From and To specification.
-
In addition to the settings discussed above, this report comes with a set of default specifications. These settings are hidden by default. If you do not want to override these default settings, then you can proceed to generate the report by clicking the Run Report button soon after you pick one/more components for report generation. However, if you want to view and then alter these settings (if required), click on the
 icon. The default settings will then appear in the MORE OPTIONS drop down window (See Figure 2). The steps below discuss each of these settings and how they can be customized.
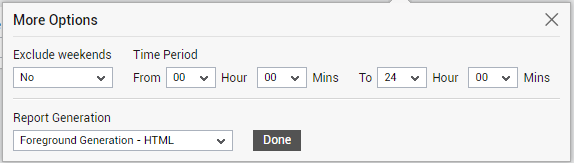
Figure 2 : The default settings for generating the JVM - CPU Analysis report
-
If the timeline specified for the report needs to exclude the data collected during the Weekends, then set Exclude weekends to Yes. If not, select No.
Note:
You can configure the days of the week that need to be considered as a ‘weekend’ using the Days parameter in the[EXCLUDE_WEEKEND] section in the eg_report.ini file (in the <EG_INSTALL_DIR>\manager\config directory). The Days parameter is set to Saturday,Sunday by default. To change this weekend specification, enter two other days of the week against the Days parameter.
- Specify the start time and end time for report generation against the Time period field (see Figure 2).
-
In large environments, reports generated using months of data can take a long time to complete. Administrators now have the option of generating reports on-line or in the background. When a report is scheduled for background generation, administrators can proceed with their other monitoring, diagnosis, and reporting tasks, while the eG manager is processing the report. This saves the administrator valuable time. To schedule background processing of a report, you can either select the Background Save - PDF or the Background Save - CSV option from the Report Generation list. In this case, a Report Name text box will appear, where you would have to provide the name with which the report is to be saved in the background. To process reports in the foreground, select the Foreground Generation - HTML option from this list.
Note:
- The default selection in the Report Generation list will change according to the Timeline specified for the report. If the Timeline set is greater than or equal to the number of days specified against the MinDurationForReport parameter in the [BACKGROUND_PROCESS] section of the eg_report.ini file, then the default selection in the Report Generation list will be Background Save - PDF. On the other hand, if the Timeline set for the report is lesser than the value of the MinDurationForReport parameter, then the default selection in the Report Generation list will be Foreground. This is because, the MinDurationForReport setting governs when reports are to be processed in the background. By default, this parameter is set to 2 weeks - this indicates that by default, reports with a timeline of 2 weeks and above will be processed in the background.
- The Report Generation list will appear only if the EnableBackgroundReport flag in the [BACKGROUND_PROCESS] section of the eg_report.ini file (in the [EG_INSTALL_DIR]\manager\config directory) is set to Yes.
- Click the Done button if any changes were made to the More Options drop down window.
-
Finally, click the Run Report button to generate the report.
-
If the option chosen from the Report Generation list is Foreground Generation - HTML, then clicking the Run Report button will reveal Figure 3.
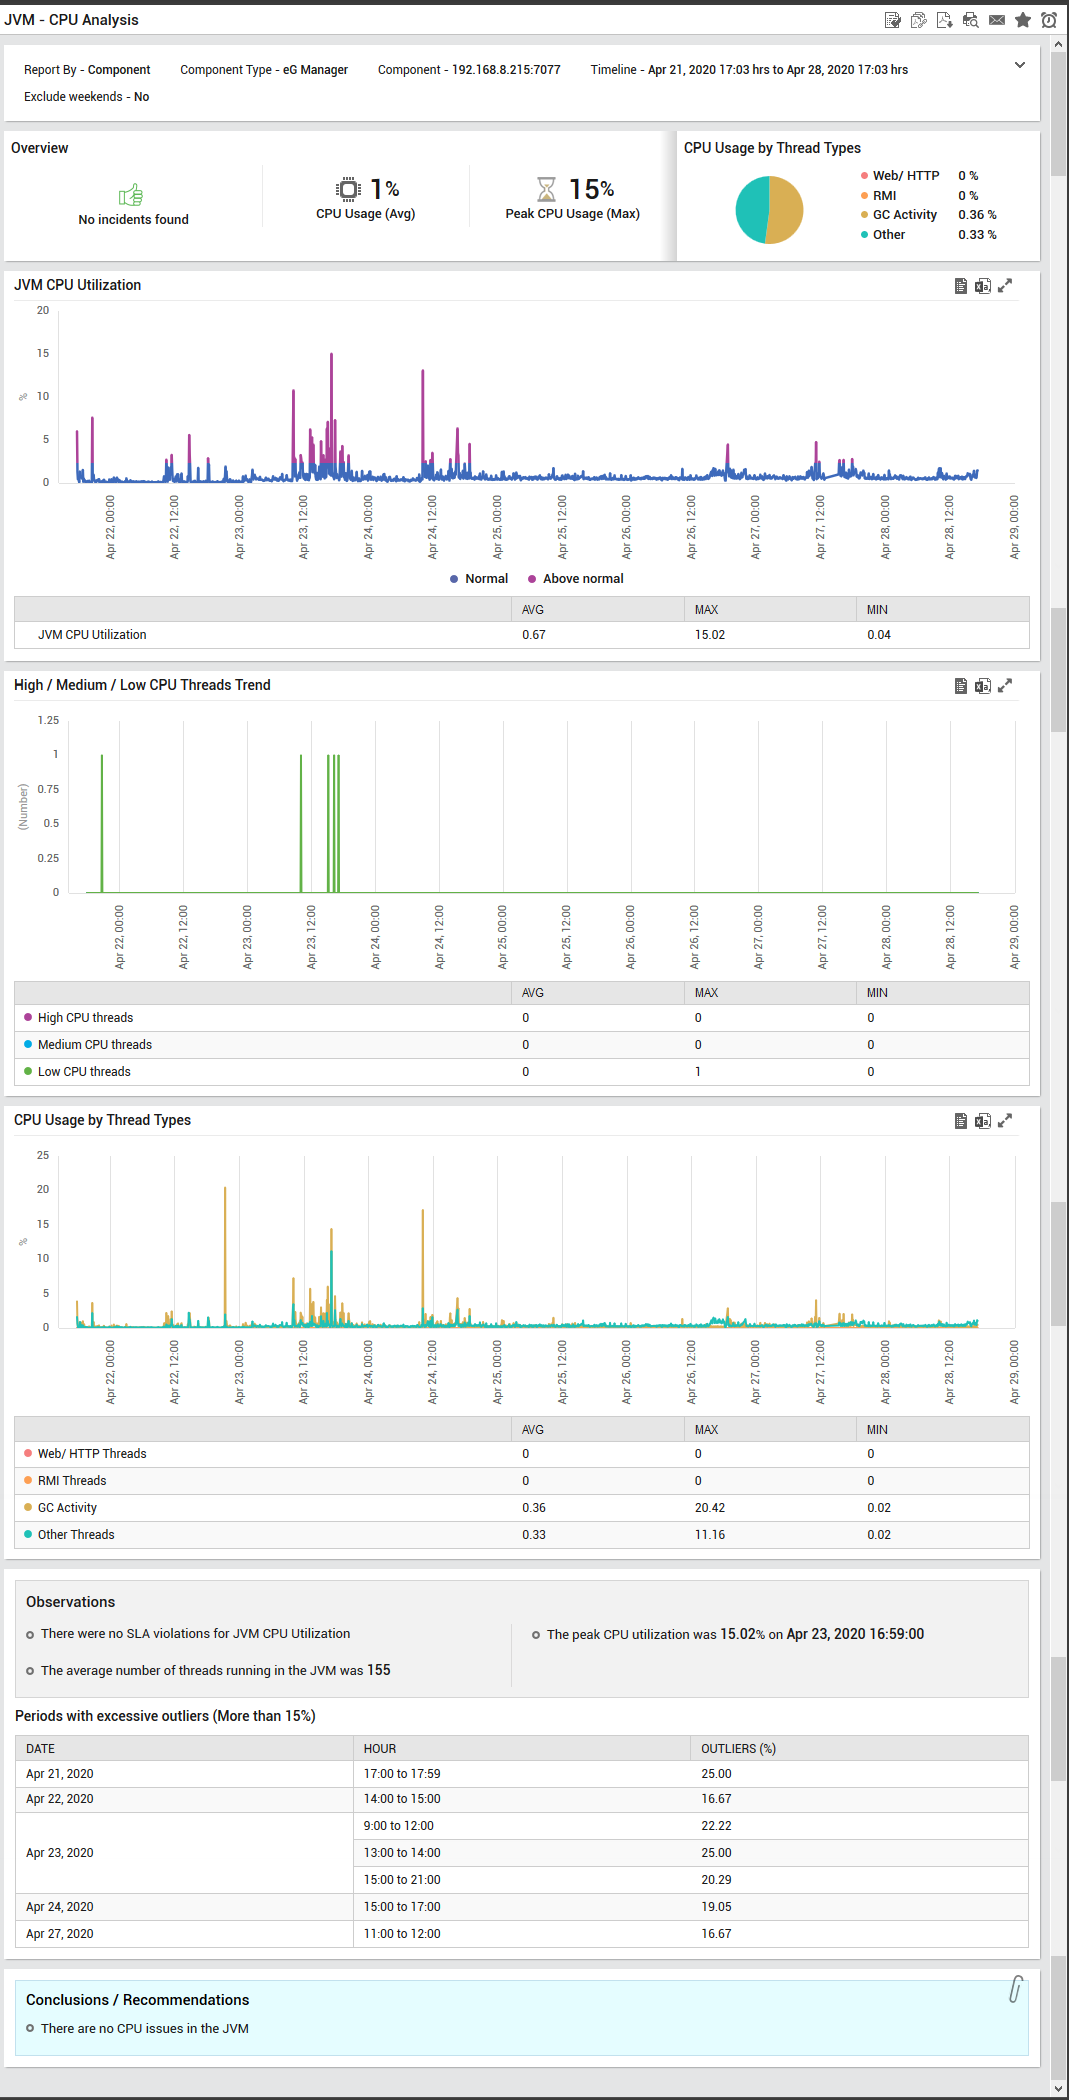
Figure 3 : The generated JVM - CPU Analysis report
From Figure 3, administrators can figure out the following:
- The Overview section reveals a color-coded doughnut that displays the count of critical / major /minor alerts raised with respect to CPU on the target JVM, the average percentage of CPU utilization and the percentage of maximum CPU usage. Clicking on the count of alerts in the Overview section will lead you to the History of Alerts Report.
- The CPU Usage by Thread Types section reveals a pie chart that shows the distribution of CPU utilized by each thread type. This pie chart will help administrators identify the thread type that is hogging the CPU resources.
- The JVM CPU Utilization section reveals a graphical representation of the CPU utilized by the JVM in the chosen time period. Administrators can infer when exactly the CPU utilization has peaked on the JVM by merely looking at the graph and initiate remedial actions. Clicking the
 icon will reveal a tabular format of the graph. You can even export the contents of this section to a CSV file by clicking the
  icon.
icon. - The High / Medium / Low CPU Threads Trend section reveals a trend graph of when exactly there was a peak in the count of high /medium / low CPU threads executing on the JVM over a period of time. Resource hungry threads can thus be identified with ease. Clicking the icon will reveal a tabular format of the graph. You can even export the contents of this section to a CSV file by clicking the icon.
- The CPU Usage by Thread Types section offers a graphical representation of when exactly the CPU utilized by each thread type peaked in the chosen time period. Using this graph. administrators can determine the exact time at which the CPU utilized by each thread type peaked and start analysis on such abnormal CPU utilization. Clicking the icon will reveal a tabular format of the graph. You can even export the contents of this section to a CSV file by clicking the icon.
- The Observations section offers a detailed insight on whether there were any SLA violations on the JVM, when exactly the peak CPU utilization was noticed, how many average number of threads were running in the JVM in the chosen time period and how long was the CPU utilization abnormal, in terms of percentage.
- The Periods with excessive outliers section reveals the exact date and time on which the CPU utilization was abnormal. The percentage of abnormal CPU utilization is also recorded in this section.
- The Conclusions / Recommendations section reveals if there are any CPU related issues in the JVM and if any issues are detected, will recommend on the actions that need to be taken to fine-tune the CPU utilization.