KPI Health Report
Analyzing a large infrastructure with hundreds of servers can take a lot of time and effort, and it also requires a great deal of expertise. Administrators may often find it tedious to analyze what exactly went wrong in their infrastructure and where does the bottleneck lie. In order to solve such an ordeal, eG Enterprise has introduced the KPI Health report. This report, when generated helps the administrators analyze the performance of an IT infrastructure in a few clicks and highlight bottleneck areas in the infrastructure.
To generate this report, do the following:
- From the Executive Reports node of the REPORTS BY FUNCTION tree, select KPI Health.
-
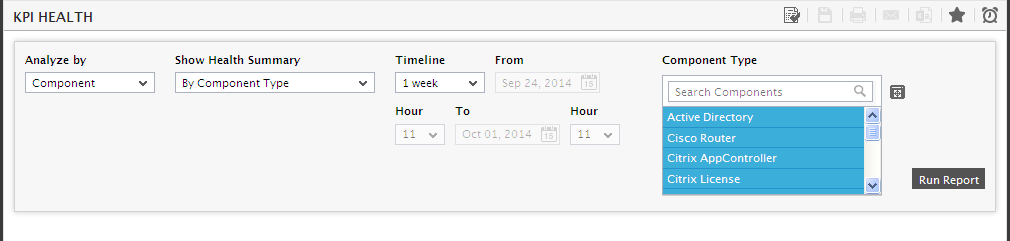
Figure 1 will then appear.
-
Select a criterion for analysis from the Analyze by list box. Using this report, you can analyze the performance of one/more independent components, or those that are part of a segment, service, or a zone. This way, you can assess the impact of the performance of the components on a particular service/segment/zone’s performance, and accordingly take performance decisions. The options provided by the Analyze by list box are discussed hereunder:
- Component: Select this option to choose the component(s) from across all the managed components in the environment. For instance, for a report on the health of all the managed vSphere/ESX hosts in the environment, select VMware vSphere ESX from the Component Type list and select Component from the Analyze by list.
- Service: Select this option if the components for which a report is to be generated are involved in the delivery of a business service. Then, select a Service.
- Segment: Choose this option if the components to be evaluated are part of a segment. Then, pick a Segment for analysis.
- Zone: Pick this option for a report on the performance of components that are included in a zone. Then, choose a Zone.
- By default, the By Component Type option will be selected from the Show Health Summary list box. This implies that the report is generated based on the health of all the components of a chosen Component Type. If the By Component option is chosen from this list, then the report will be generated for each component of the chosen Component Type.
- Next, from the Component Type list, select the virtual server type for which this report is to be generated. If this list consists of too many Component Types, then viewing all the component types and selecting the ones you need for report generation could require endless scrolling. To avoid this, you can click the
 icon next to the Component Type list. This will open the COMPONENT TYPE pop up window using which you can view almost all the component types in a single interface and Select the ones for which the report is to be generated. If there are still too many component types in the list to choose from, you can narrow your search further by using the Search text box. Specify the whole/part of the component type to search for in this text box, and click the icon next to it. The Component Type list will then be populated with all component types that embed the specified search string. Select the component type of your choice from this list.
 -
Specify a Timeline for the report.
Note:
For every user registered with the eG Enterprise system, the administrator can indicate the maximum timeline for which that user can generate a report. Once the maximum timeline is set for a user, then, whenever that user logs into eG Reporter and attempts to generate a report, the Timeline list box in the report page will display options according to the maximum timeline setting of that user. For instance, if a user can generate a report for a maximum period of 3 days only, then 3 days will be the highest option displayed in the Timeline list - i.e., 3 days will be the last option in the fixed Timeline list. Similarly, if the user chooses the Any option from the Timeline list and proceeds to provide a start date and end date for report generation using the From and To specifications, eG Enterprise will first check if the user's Timeline specification conforms to his/her maximum timeline setting. If not, report generation will fail. For instance, for a user who is allowed to generate reports spanning over a maximum period of 3 days only, the difference between the From and To dates should never be over 3 days. If it is, then, upon clicking the Run Report button a message box will appear, prompting the user to change the From and To specification.
-
In addition to the settings discussed above, this report comes with a set of default specifications. These settings are hidden by default. If you do not want to disturb these default settings, then you can proceed to generate the report by clicking the Run Report button soon after you pick one/more Component Types for report generation. However, if you want to view and then alter these settings (if required), click on the
 icon. The default settings will then appear in the MORE OPTIONS drop down window (see Figure 2). The steps below discuss each of these settings and how they can be customized.
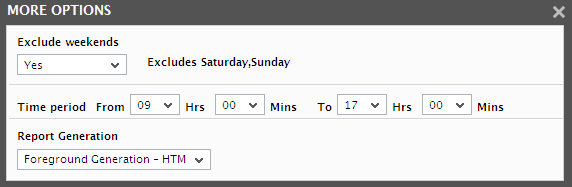
Figure 2 : The default settings for generating the KPI Health report
-
If the timeline specified for the report needs to exclude the data collected during the Weekends, then set Exclude weekends to Yes. If not, select No.
Note:
By default, the weekend constitutes Saturday and Sunday. To override this default setting, do the following:
- Edit the eg_report.ini file in the <EG_INSTALL_DIR>\manager\config directory.
- In the [virtual_measure_group] section of the file, the exclude_weekend parameter is set to Saturday,Sunday by default. You can modify this by setting the exclude_weekend parameter to a comma-separated list of other days of the week - say Friday,Saturday.
- Save the file after making the required changes.
- Next, indicate the report Timeperiod.
-
In large environments, reports generated using months of data can take a long time to complete. Administrators now have the option of generating reports on-line or in the background. When a report is scheduled for background generation, administrators can proceed with their other monitoring, diagnosis, and reporting tasks, while the eG manager is processing the report. This saves the administrator valuable time. To schedule background processing of a report, select the Background Save - PDF option from the Report Generation list. In this case, a Report Name text box will appear, where you would have to provide the name with which the report is to be saved in the background. To process reports in the foreground, select the Foreground Generation - HTML option from this list.
Note:
- The Report Generation list will appear only if the EnableBackgroundReport flag in the [BACKGROUND_PROCESS] section of the eg_report.ini file (in the {EG_INSTALL_DIR}\manager\config directory) is set to Yes.
- The default selection in the Report Generation list will change according to the Timeline specified for the report. If the Timeline set is greater than or equal to the number of days specified against the MinDurationForReport parameter in the [BACKGROUND_PROCESS] section of the eg_report.ini file, then the default selection in the Report Generation list will be Background Save - PDF. On the other hand, if the Timeline set for the report is lesser than the value of the MinDurationForReport parameter, then the default selection in the Report Generation list will be Foreground. This is because, the MinDurationForReport setting governs when reports are to be processed in the background. By default, this parameter is set to 2 weeks - this indicates that by default, reports with a timeline of 2 weeks and above will be processed in the background.
- Finally, click the Run Report button to generate the report.
-
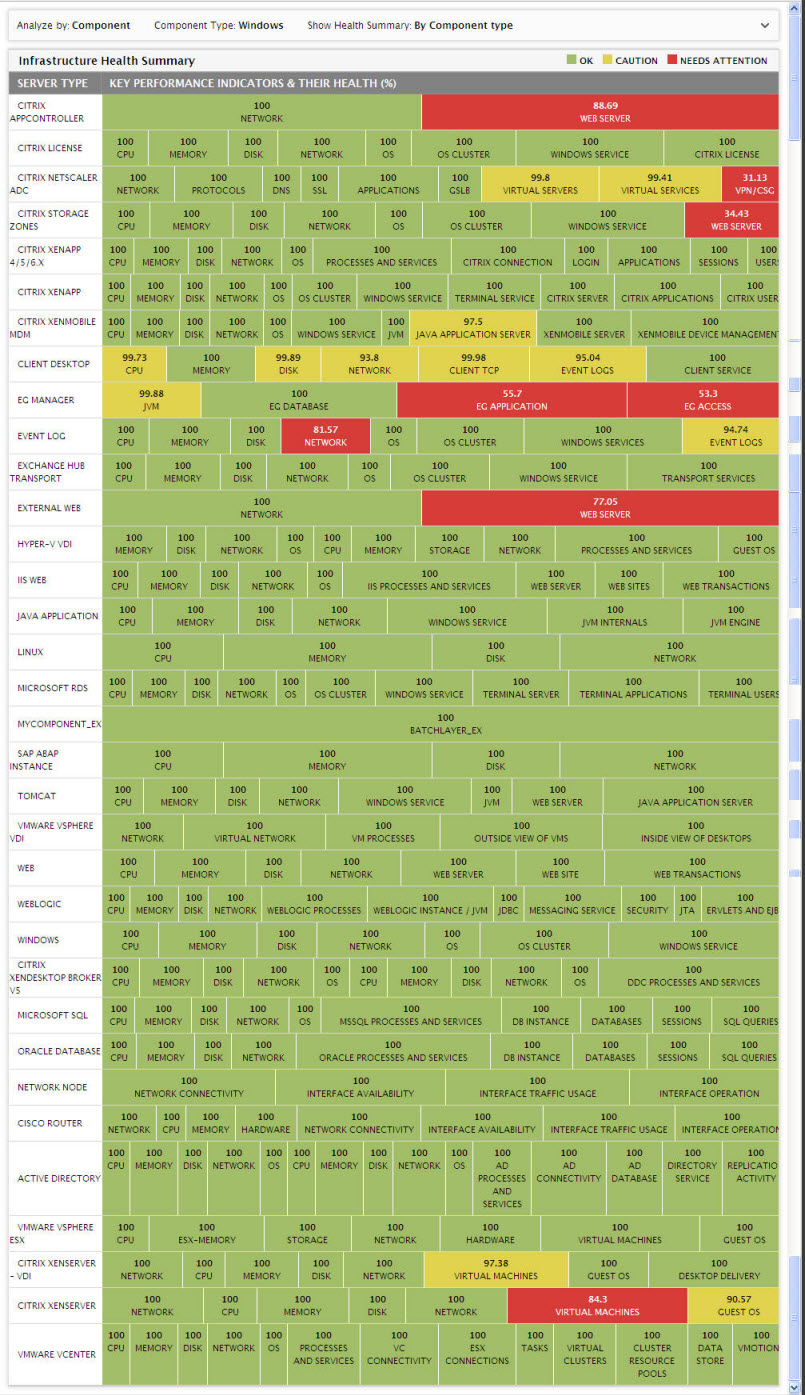
The KPI Health report will be generated as shown in Figure 3.
-
From the generated report, you can easily identify the health of the target infrastructure. The generated report consists of the Server Type column and the Key Performance Indicators and their Health(%) column. The Key Performance Indicators and their Health column is further divided in terms of the layers available for the chosen Component Type. The health of each layer is represented using distinct colors and values as mentioned in the table below:
Color Value Health Green 100 OK Orange less than 100 and greater than 90 Caution Red less than 90 Needs attention Note:
Administrators can do the following to reconfigure the values with the values of their choice:
- Edit the eg_report.ini file in the <EG_INSTALL_DIR>\manager\config directory.
- In the [INFRASTRUCTURE_HEALTH_REPORT] section of the file, the UnhealthyBound1 parameter is set to 100 and the UnhealthyBound2 parameter is set to 90 by default. You can modify this by setting the values of your choice for these parameters. If you set the UnhealthyBound1 to 90 and the UnhealthyBound2 to 80, then the color Red will appear for a value less than 80 in the generated report and the color Orange will appear for the value less than 90 and greater than 80 in the generated report.
- Save the file after making the required changes.
-
If the By Component option is chosen from the Show Health Summary, then an additional Component column will appear. The report will be generated for each individual component of the chosen Component Type (see Figure 4).
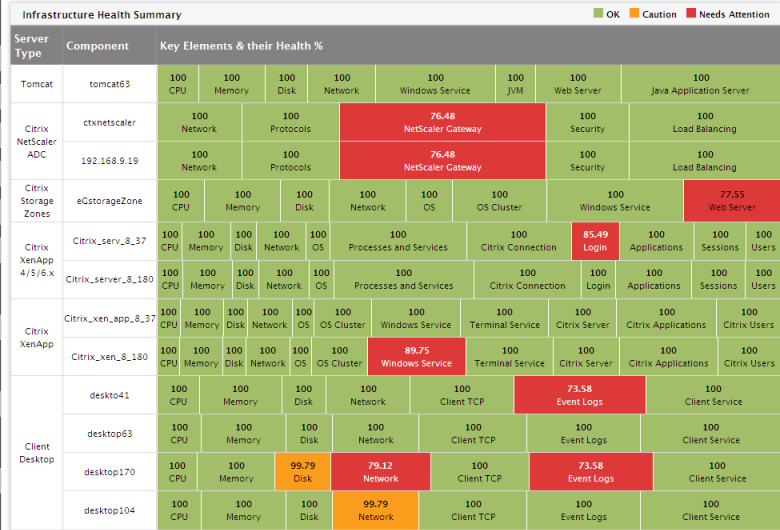
Figure 4 : The KPI Health Report when the ‘By Component’ option is chosen
-
If the By Infrastructure Tier option is chosen from the Show Health Summary, then an additional Infrastructure Tier column will appear in the report. This Infrastructure Tier column shows the category name of the Component Types that possess similar functionalities i.e., the component types with similar functionalities will be logically grouped under a common category name. For example, the Oracle Database and Microsoft SQL Component Types will be grouped under the Database Servers (see Figure 5).
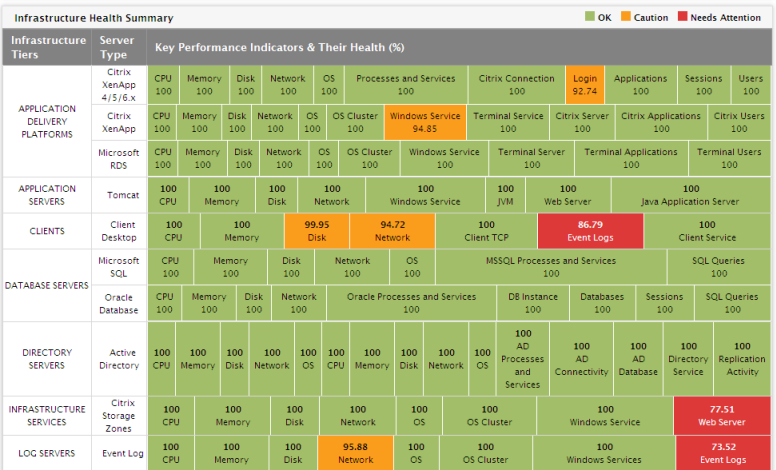
Figure 5 : The KPI Health report when the By Infrastructure Tier option is clicked
-
Administrators can further drill down the report and figure out the exact bottleneck area in the infrastructure by clicking each problematic layer of the chosen Component Type. In our example, let us click on the Virtual Servers layer of the Citrix Netscaler ADC component (see Figure 1), a pop up window will appear as shown in Figure 6 listing the problems that are currently affecting the health of the layer.
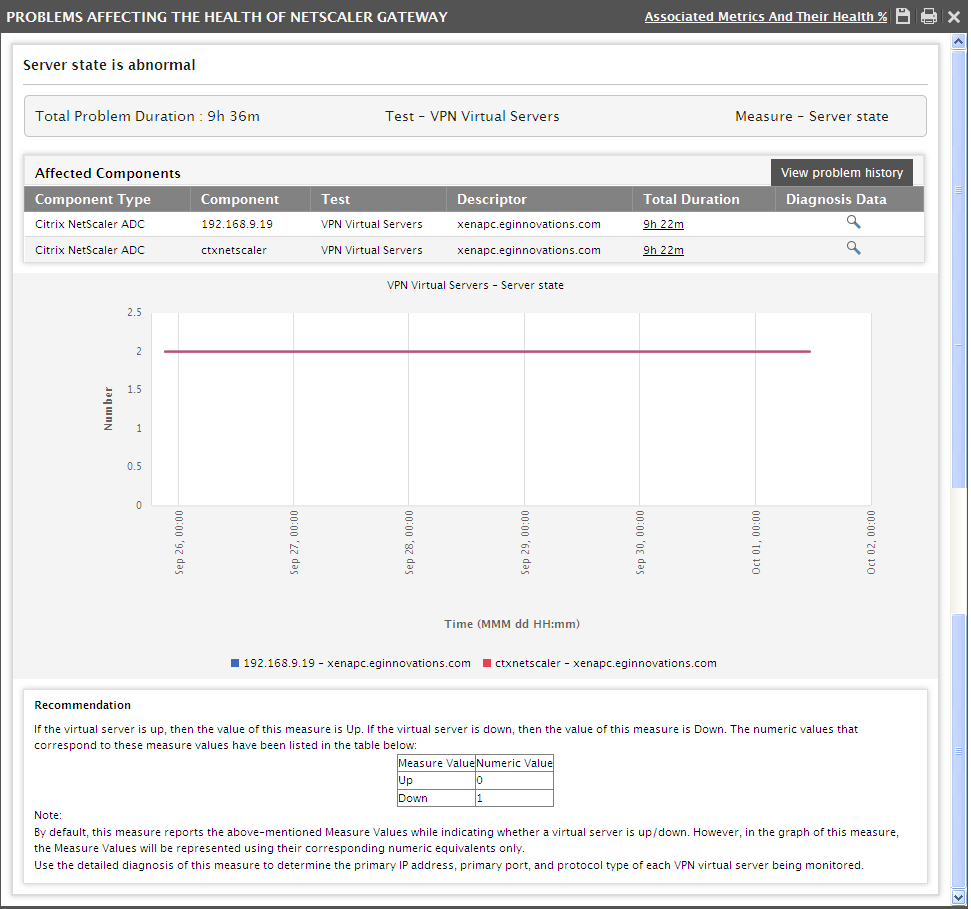
Figure 6 : The pop up window that lists the currently existing problems in the layer
- From Figure 6, you can easily identify that each problem encountered by the layer has been dealt with a graphical representation and the duration of the problem. You can also easily identify the Test and the Measure that is causing the problem and the total time duration for which this measure has been problematic can be identified using the Total Problem Duration field. Additionally, a graph represents the exact time duration for which this measure has been problematic. The Recommendation section helps you in interpreting the problem and provides suggestions to overcome the problem (in some cases).
-
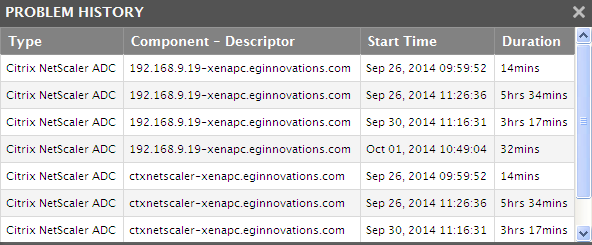
Clicking the View Problem History button of Figure 6 opens a PROBLEM HISTORY pop up window (see Figure 7) which lists the time periods during which the health of the chosen components were affected.
-
If the detailed diagnosis for a chosen measure is collected by the eG egent, then clicking on the
 icon of Figure 6 will lead you to Figure 8 that shows the Detailed diagnosis of the measure.
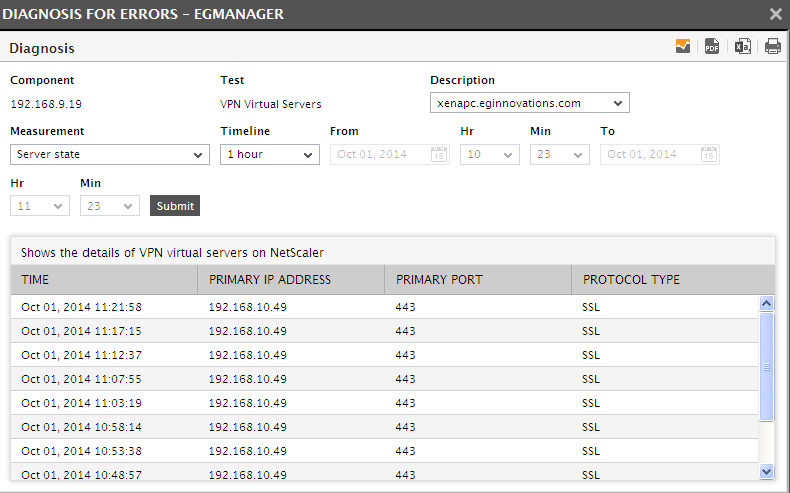
-
To view the health of all the measures that are associated with the chosen component and Component Type, click on the Associated Metrics and Their Health% link in Figure 6. This will lead you to Figure 9 where you will be able to figure out the measures that have been problematic and affecting the overall health of the chosen Component Type.
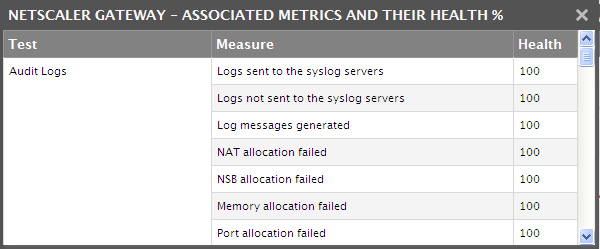
Figure 9 : The pop up window displaying the health of the metric associated with the chosen Component Type