Logon Failures Report
Frequent login failures and inexplicable delays when accessing a server will always have an adverse impact on a user’s experience with the server. eG Enterprise captures such failures/delays proactively and isolates their root-cause by figuring out problematic failure patterns so that the user experience on the server is not impacted. The Logon Failures report helps administrators in this regard!
To generate this report, do the following:
-
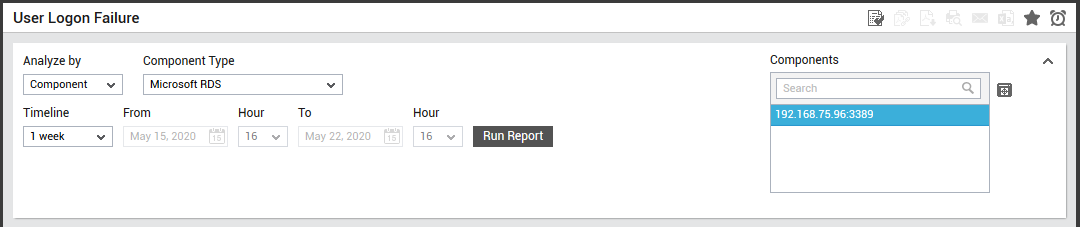
Follow the menu sequence: REPORTS BY FUNCTION -> Analytical Reports - > Event Log Reports -> Logon Failures. Figure 7 will then appear.
-
Using this report, you can analyze the logon failures of users on one/more managed components, or those that are part of a zone, service or segment. The options provided by the Analyze By list box are discussed hereunder:
- Component: Select this option to choose the component(s) from across all the managed components in the environment.
- Zone: To generate a report for one/more components that are included in a zone, pick the Zone option. A Zone drop-down list will then appear, from which you would have to select the zone to which the components of interest to you belong. A Sub zone flag also appears. Indicate whether the components present within the sub-zones of the chosen zone are also to be to be considered for report generation, by setting the Sub zone flag to Yes.
- Segment: If you want to generate a report for one/more chosen components that belong to a segment, select the Segment option from Analyze By list box, and then pick the Segment from the drop-down list that appears.
- Service: If you want to generate a report for one/more components involved in the delivery of a service, select the Service option from Analyze By, and then pick the required Service from the drop-down list that appears.
- Choose a Component Type for which the report is to be generated.
- The Components list will now be populated with all the components that are managed in your environment for the chosen component type. If the Components list consists of too many components, then viewing all the components and selecting the ones you need for report generation could require endless scrolling. To avoid this, you can click the
 button next to the Components list. A Components pop up window will then appear using which you can view almost all the components in a single interface and Select the ones to be included in this report.
 -
Specify a Timeline for the report.
Note:
For every user registered with the eG Enterprise system, the administrator can indicate the maximum timeline for which that user can generate a report. Once the maximum timeline is set for a user, then, whenever that user logs into eG Reporter and attempts to generate a report, the Timeline list box in the report page will display options according to the maximum timeline setting of that user. For instance, if a user can generate a report for a maximum period of 3 days only, then 3 days will be the highest option displayed in the Timeline list - i.e., 3 days will be the last option in the fixed Timeline list. Similarly, if the user chooses the Any option from the Timeline list and proceeds to provide a start date and end date for report generation using the From and To specifications, eG Enterprise will first check if the user's Timeline specification conforms to his/her maximum timeline setting. If not, report generation will fail. For instance, for a user who is allowed to generate reports spanning over a maximum period of 3 days only, the difference between the From and To dates should never be over 3 days. If it is, then, upon clicking the Run Report button a message box will appear, prompting the user to change the From and To specification.
-
In addition to the settings discussed above, this report comes with a set of default specifications. These settings are hidden by default. If you do not want to disturb these default settings, then you can proceed to generate the report by clicking the Run Report button soon after you pick a Component Type. However, if you want to view and then alter these settings (if required), click on the
 button. The default settings will then appear in the MORE OPTIONS drop down window (see Figure 8). The steps below discuss each of these settings and how they can be customized.
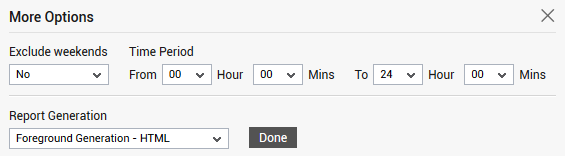
- Specify the start time and end time for report generation against the Time period field (see Figure 8).
-
If the timeline specified for the report needs to exclude the data collected during the Weekends, then set Exclude weekends to Yes. If not, select No.
Note:
The Weekend settings for a Consolidated Zone report will apply to this report too.
-
In large environments, reports generated using months of data can take a long time to complete. Administrators now have the option of generating reports on-line or in the background. When a report is scheduled for background generation, administrators can proceed with their other monitoring, diagnosis, and reporting tasks, while the eG manager is processing the report. This saves the administrator valuable time. To schedule background processing of a report, you can either select the Background Save - PDF option or the Background Save - CSV option from the Report Generation list. In this case, a Report Name text box will appear, where you would have to provide the name with which the report is to be saved in the background. To process reports in the foreground, select the Foreground Generation - HTML option from this list.
Note:
- The Report Generation list will appear only if the EnableBackgroundReport flag in the [BACKGROUND_PROCESS] section of the eg_report.ini file (in the [EG_INSTALL_DIR]\manager\config directory) is set to Yes.
- The default selection in the Report Generation list will change according to the Timeline specified for the report. If the Timeline set is greater than or equal to the number of days specified against the MinDurationForReport parameter in the [BACKGROUND_PROCESS] section of the eg_report.ini file, then the default selection in the Report Generation list will be Background Save - PDF. On the other hand, if the Timeline set for the report is lesser than the value of the MinDurationForReport parameter, then the default selection in the Report Generation list will be Foreground. This is because, the MinDurationForReport setting governs when reports are to be processed in the background. By default, this parameter is set to 2 weeks - this indicates that by default, reports with a timeline of 2 weeks and above will be processed in the background.
- Finally, click the Run Report button to generate the report.
-
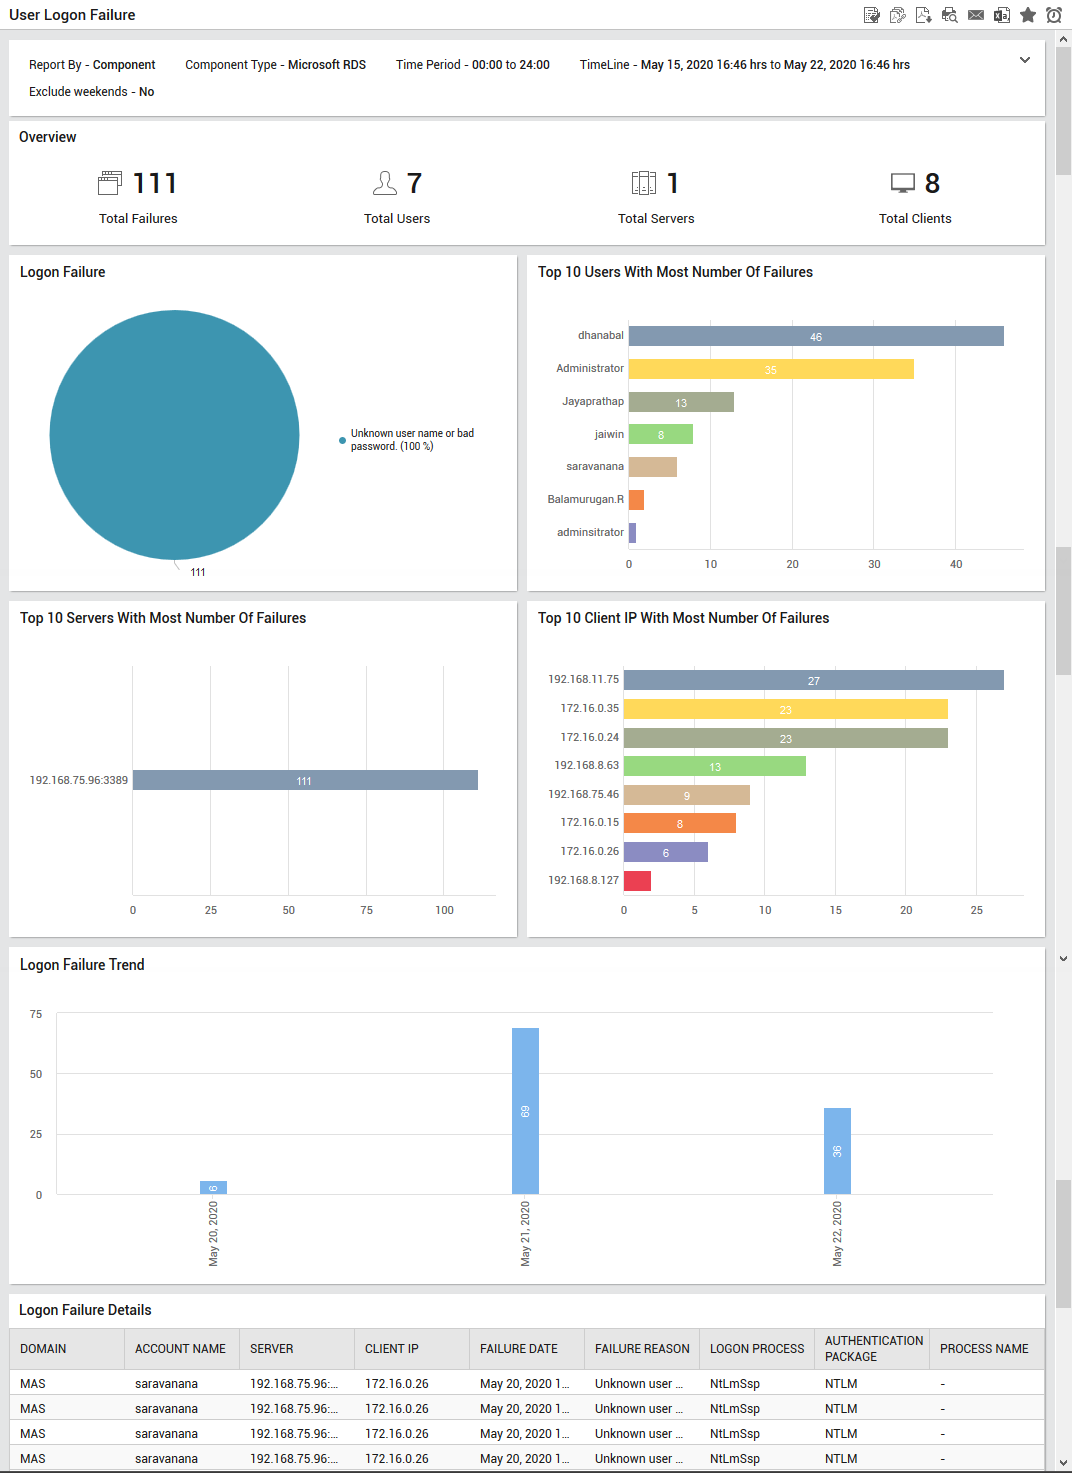
If the Report type is Foreground Generation - HTML, then Figure 9 will appear as soon as you click the Run Report button.
-
The generated report (see Figure 9) contains the following sections:
- The Overview section reveals the total number of logon failures that were captured in the chosen time period and the count of unique users who encountered logon failures. Using this section, administrators can figure out the total number of server and clients that are frequently affected by logon failures.
- The Logon Failures pie chart provides a distribution of logon failure types enountered by the users. Using this pie chart, administrators can figure out the reason that has dominated in logon failures.
- A series of bar graphs reveals the top 10 users who encountered logon failures, the top 10 servers on which logon failures were noticed and the top 10 client IPs through which the users logged in to the server. These sections will help administrators identify the user who has most frequently encountered logon failures.
- The Logon Failure Trend section will provide administrators with the exact date/time on which failures were noticed more frequently. Administrators can pick the date/time to further analyze problematic patterns.
-
The Logon Failure Details section will reveal the domain, server, client IP, the exact time and date of failure, the reason for logon failure, the logon process etc. This will help administrators figure out when exactly the failure was noticed and what was the reason behind the failure.
Using , administrators can figure out the components on which the application failed, when exactly the failure occurred, what was the problem condition ( crash or hang) and the location at which the application was installed.
- If the Background Save - PDF option is chosen from the Report Generation list, then clicking on the Run Report button will not generate the report and display it in this page for your benefit. Instead, a message indicating that the report is being processed in the background will appear. This will be accompanied by a link that will lead you to the page that lists all the reports that are being processed in the background, and their current status. If background report generation fails for a report, you can regenerate that report using this page, or can even delete that report if need be. On the other hand, if background processing successfully completes for your report, then, you can view a PDF of the report by clicking on the
 icon in that page.