Logon Simulation - By Application / Desktop Report
This report helps administrators identify the problem-prone application/desktop in your farm, zoom into its logon performance, and diagnose its root-cause. A single glance at this report will reveal the following:
- Which application/desktops the simulator attempted to launch during the said timeline?
- In which simulation were logon performance issues detected time and again?
- At which step of the logon process were issues often detected?
- What was causing the issues - was it because a particular operation failed frequently? or was it because a particular operation was consistently taking longer than a configured (acceptable) duration?
- Which operation (login, enumeration, or launch) is problem-prone?
To generate this report, do the following:
-
Select the By Application option by following the menu sequence: REPORTS BY FUNCTION -> Logon Simulation. Figure 1 then appears.
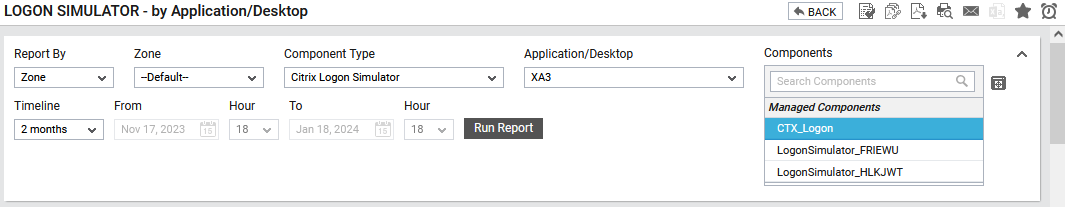
Figure 1 : Specifying the criteria for the Logon Simulation - By Application report
-
In Figure 1 that appears, select a criterion for analysis from the Report By list box. Using this report, you can analyze the logon simulation of one/more independent virtualized components, or those that are part of a segment, service, or a zone. This way, you can assess the impact of the applications hosted on the virtual components of a particular service/segment/zone, and accordingly take decisions. The options provided by the Report By list box are discussed hereunder:
- Component:Select this option to choose the component(s) from across all the managed components in the environment. For instance, for a report on the logon simulations performed on the
 button next to the Components list. The COMPONENTS pop up window will then appear using which you can view almost all the components in a single interface and Select the ones for which the report is to be generated. You can narrow your search further by using the Search text box. Specify the whole/part of the component name to search for in this text box, and click the icon next to it.
 - Zone: Pick this option for a report on the performance of virtual components that are included in a zone. Then, choose a Zone. A Sub zone flag also appears. Indicate whether the components present within the sub-zones of the chosen zone are also to be to be considered for report generation, by setting the Sub zone flag to Yes.
- Segment: Choose this option if the virtual hosts to be evaluated are part of a segment. Then, pick a Segment for analysis.
- Service: Select this option if the components for which a report is to be generated are involved in the delivery of a business service. Then, select a Service.
- Component:Select this option to choose the component(s) from across all the managed components in the environment. For instance, for a report on the logon simulations performed on the
-
Then, select the application from the Application list for which the report should be generated. By default, All option is chosen from this list.
-
Then, specify the Timeline for the graph. You can either provide a fixed time line such as 1 hour, 2 days, etc., or select the Any option from the list to provide a From and To date/time for report generation.
Note:
For every user registered with the eG Enterprise system, the administrator can indicate the maximum timeline for which that user can generate a report. Once the maximum timeline is set for a user, then, whenever that user logs into eG Reporter and attempts to generate a report, the Timeline list box in the report page will display options according to the maximum timeline setting of that user. For instance, if a user can generate a report for a maximum period of 3 days only, then 3 days will be the highest option displayed in the Timeline list - i.e., 3 days will be the last option in the fixed Timeline list. Similarly, if the user chooses the Any option from the Timeline list and proceeds to provide a start date and end date for report generation using the From and To specifications, eG Enterprise will first check if the user's Timeline specification conforms to his/her maximum timeline setting. If not, report generation will fail. For instance, for a user who is allowed to generate reports spanning over a maximum period of 3 days only, the difference between the From and To dates should never be over 3 days. If it is, then, upon clicking the Run Report button a message box will appear, prompting the user to change the From and To specification.
-
In addition to the settings discussed above, this report comes with a set of default specifications. These settings are hidden by default. If you do not want to disturb these default settings, then you can proceed to generate the report by clicking the Run Report button soon after you pick one/more components for report generation. However, if you want to view and then alter these settings (if required), click on the
 icon. The default settings will then appear in the MORE OPTIONS drop down window (See Figure 2). The steps below discuss each of these settings and how they can be customized.
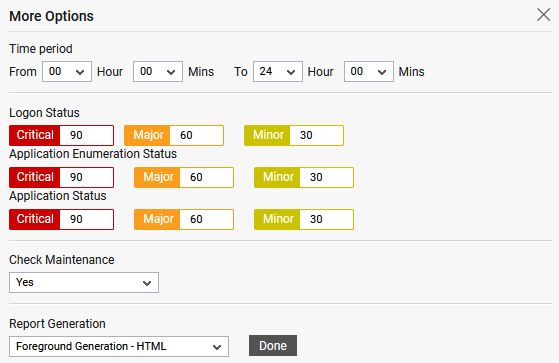
-
Next, indicate the report Time period.
Note:
By default, the Time period is set to 24 hours. Accordingly, the From and To parameters in the [timeframe] section of the eg_report.ini file (in the <eg_install_dir>\manager\config directory) are set to 00:00 and 24:00 respectively. If need be, you can override this default setting by configuring a different timeframe against the From and/or To parameters.
-
eG Enterprise System offers the flexibility of allowing the administrators to view the abnormality experienced by an application during logon from the generated report at a single glance. This can be achieved by providing the lower/higher threshold limits of your choice i.e., providing the Minor/Major/Critical values in the appropriate colored text boxes underneath the Logon Duration (secs) option. Doing so, whenever the logon duration of the application violate the specified threshold values, the logon duration of that particular application will be highlighted with the corresponding color of the specified text box in the generated report. This way, you can easily identify abnormalities experienced by the application during logon in your environment. Similarly, you are allowed to set the threshold limits for the application enumeration duration underneath the Application Enumeration Duration (secs) option as well as the application launch duration underneath the Application Launch Duration (secs) option.
-
In some environments, to perform one/more administrative activities on a few severs, administrators may deliberately put those servers under maintenance. While generating reports for those servers, administrators may want to ignore the time for which the servers were under maintenance i.e., consider that the servers were up and running during the maintenance period. To this effect, the Check Maintenance list is set to Yes, by default. If you wish to generate the report considering the maintenance period as downtime, then choose No from this list.
-
In large environments, reports generated using months of data can take a long time to complete. Administrators now have the option of generating reports on-line or in the background. When a report is scheduled for background generation, administrators can proceed with their other monitoring, diagnosis, and reporting tasks, while the eG manager is processing the report. This saves the administrator valuable time. To schedule background processing of a report, you can either select the Background Save - PDF option from the Report Generation list. In this case, a Report Name text box will appear, where you would have to provide the name with which the report is to be saved in the background. To process reports in the foreground, select the Foreground Generation - HTML option from this list.
Note:
- The Report Generation list will appear only if the EnableBackgroundReport flag in the [BACKGROUND_PROCESS] section of the eg_report.ini file (in the [EG_INSTALL_DIR]\manager\config directory) is set to Yes.
- The default selection in the Report Generation list will change according to the Timeline specified for the report. If the Timeline set is greater than or equal to the number of days specified against the MinDurationForReport parameter in the [BACKGROUND_PROCESS] section of the eg_report.ini file, then the default selection in the Report Generation list will be Background Save - PDF. On the other hand, if the Timeline set for the report is lesser than the value of the MinDurationForReport parameter, then the default selection in the Report Generation list will be Foreground. This is because, the MinDurationForReport setting governs when reports are to be processed in the background. By default, this parameter is set to 2 weeks - this indicates that by default, reports with a timeline of 2 weeks and above will be processed in the background.
- Finally, click the Run Report button to generate the report.
-
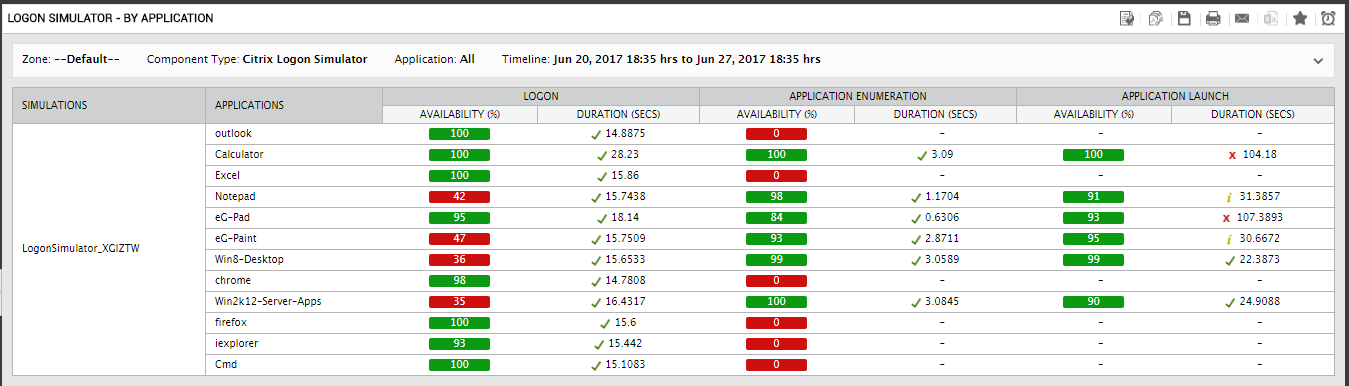
If the Report type is Foreground Generation - HTML, then Figure 3 will appear as soon as you click the Run Report button.
-
For each simulation and application chosen, this report provides the following:
- The availability and logon duration of the application;
- The application enumeration duration and
- The application launch duration.
-
Zooming into a particular application/desktop from Figure 3 provides a quick summary of the results of all simulations performed by the simulator for the chosen application/desktop (see Figure 4).
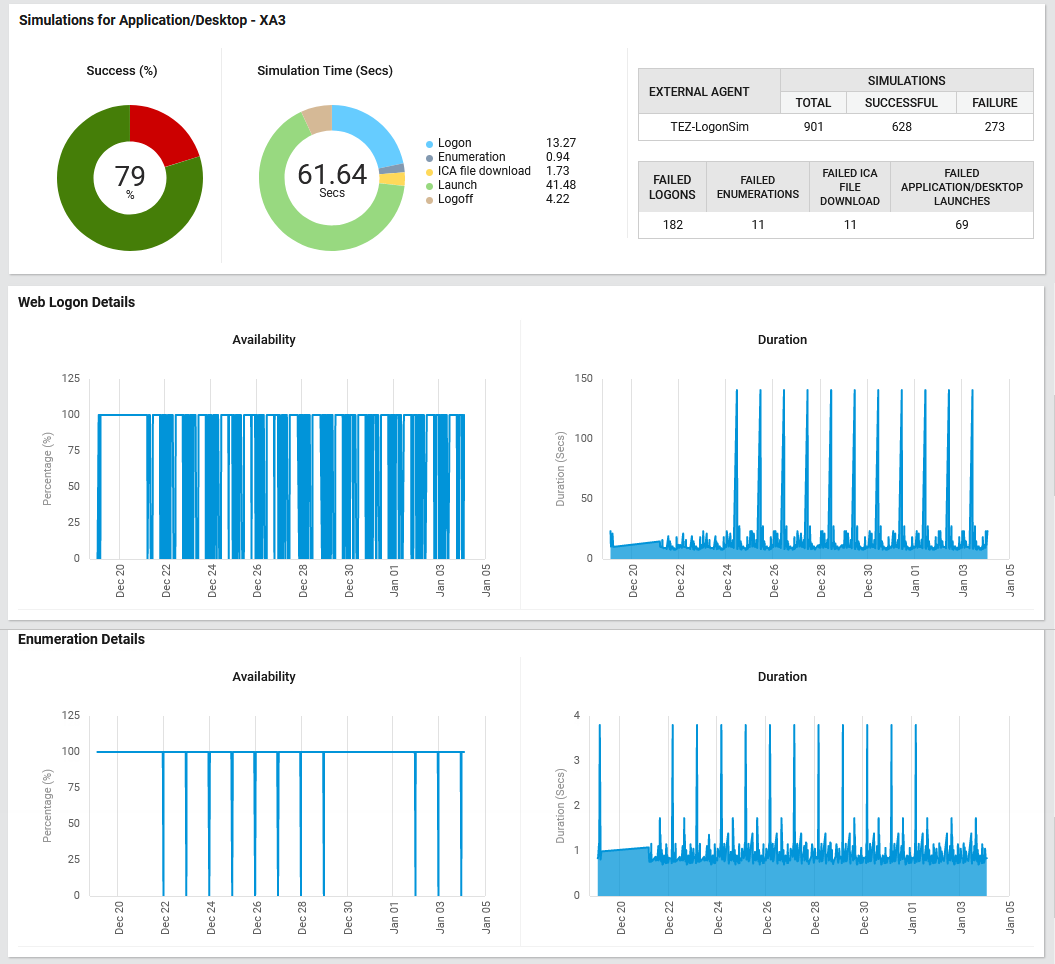
- From the Simulations for Application/Desktop section of Figure 4, you can instantly infer if simulations for the application/desktop have failed more often than they have succeeded. If so, this section also points you to the probable cause of these failures - login? enumeration? or application launch? Also, this section reveals where exactly the simulation spent a lot of time - is it during enumeration? or ICA file dwnload? or Application launch? or Logoff?
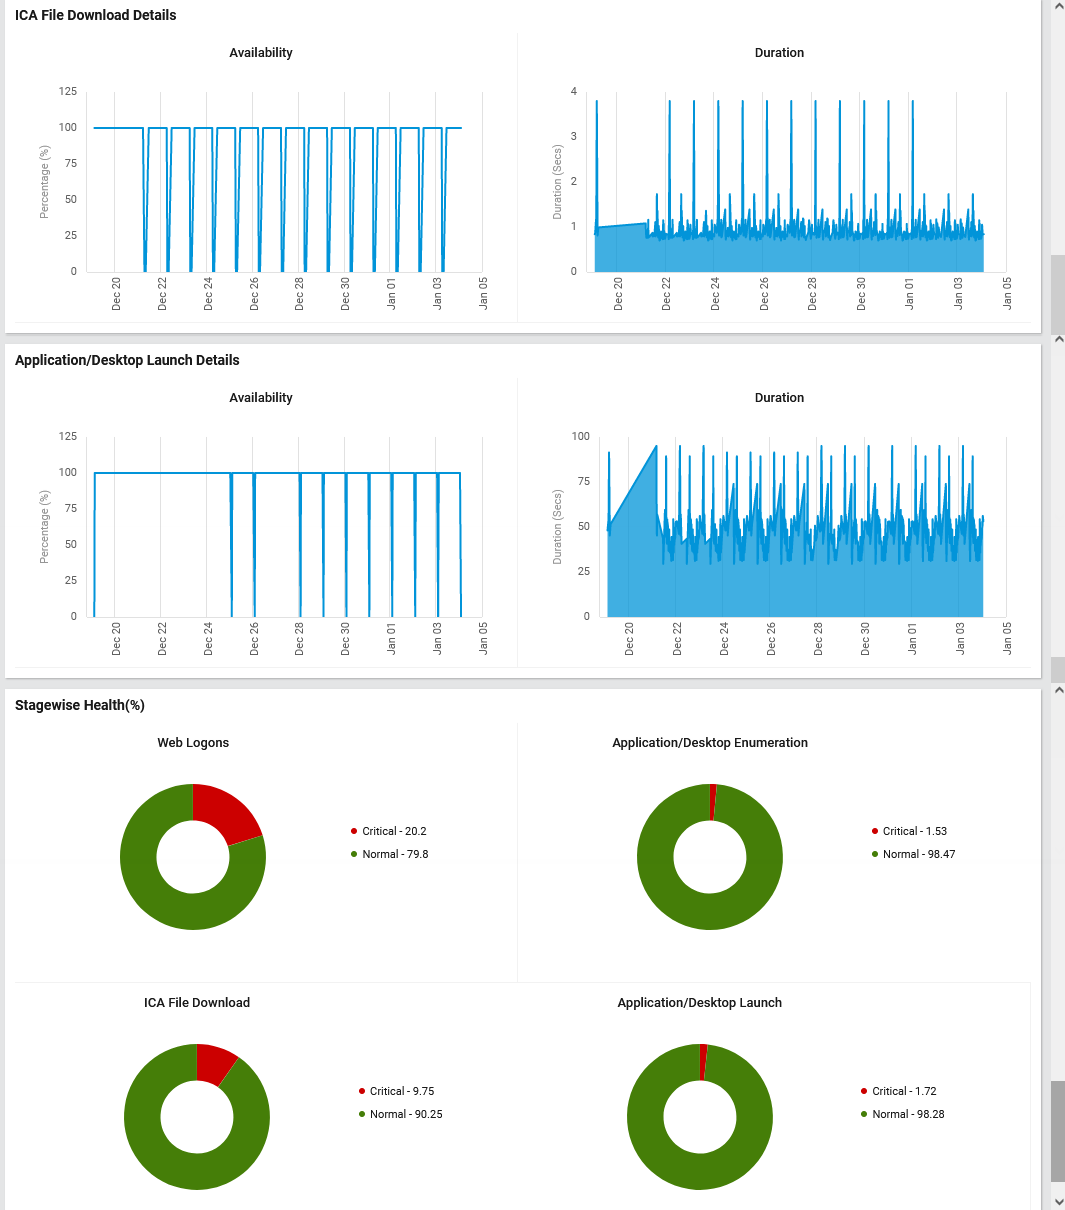
Figure 5 : The graphs and the Application health doughnut charts
- You can then use the graphs in this page (see Figure 4 and Figure 5) to isolate exactly when during the given timeline, simulations for that application/desktop failed or took longer than usual. Ascertain the overall application health during the specified timeline using the Application Health doughnut. This will reveal whether the application/desktop was healthy or in an abnormal state the majority of time.
- On the other hand, if the Background Save - PDF option is chosen from the Report Generation list, then clicking on the Run Report button will not generate the report and display it in this page for your benefit. Instead, a message indicating that the report is being processed in the background will appear. This will be accompanied by a link that will lead you to the page that lists all the reports that are being processed in the background, and their current status. If background report generation fails for a report, you can regenerate that report using this page, or can even delete that report if need be. On the other hand, if background processing successfully completes for your report, then, you can view a PDF of the report by clicking on the
 icon in that page.