Machine Utilization Report
This report provides administrators with an overview of the status of virtual machines/virtual desktops in each Citrix delivery group. Using this report, administrators can identify the delivery groups where many machines/virtual desktops are in an abnormal state – for e.g., unregistered, unavailable, disconnected etc. – and are hence not ready to be assigned to users. The usage of machines/desktops can also be analyzed per delivery group, so that over-utilized groups and least-used groups can be accurately isolated.
To generate this report, do the following:
- Follow the menu sequence: REPORTS BY FUNCTION -> Domain-specific Reports -> Virtual Applications / Desktops (Citrix XenApp / XenDesktop) -> Citrix Connection Brokering -> Machine Utilization.
-
Figure 1 then appears. In Figure 1, select a criteria for analysis from the Analyze By list box.
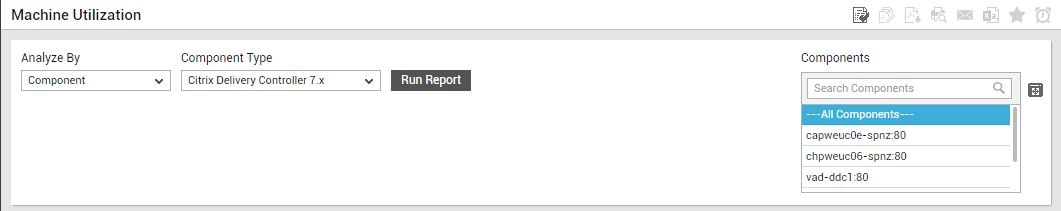
Figure 1 : Specifying the criteria for generating the Machine Utilization report
-
Using this report, you can analyze the state of the machines on one/more managed components, or those that are part of a zone, service or segment. The options provided by the Analyze By list box are discussed hereunder:
- Component: Select this option to choose the component(s) from across all the managed components in the environment.
- Zone: To generate a report for one/more components that are included in a zone, pick the Zone option. A Zone drop-down list will then appear, from which you would have to select the zone to which the components of interest to you belong. A Sub zone flag also appears. Indicate whether the components present within the sub-zones of the chosen zone are also to be to be considered for report generation, by setting the Sub zone flag to Yes.
- Segment: If you want to generate a report for one/more chosen components that belong to a segment, select the Segment option from Analyze By list box, and then pick the Segment from the drop-down list that appears.
- Service: If you want to generate a report for one/more components involved in the delivery of a service, select the Service option from Analyze By, and then pick the required Service from the drop-down list that appears.
- Choose a Component Type for which the report is to be generated.
- The Components list will now be populated with all the components that are managed in your environment for the chosen component type. If the Components list consists of too many components, then viewing all the components and selecting the ones you need for report generation could require endless scrolling. To avoid this, you can click the
 button next to the Components list. A Components pop up window will then appear using which you can view almost all the components in a single interface and Select the ones to be included in this report.
 -
In addition to the settings discussed above, this report comes with a set of default specifications. These settings are hidden by default. If you do not want to disturb these default settings, then you can proceed to generate the report by clicking the Run Report button soon after you pick one/more components for report generation. However, if you want to view and then alter these settings (if required), click on the
 icon. The default settings will then appear in the MORE OPTIONS drop down window (See Figure 2). The steps below discuss each of these settings and how they can be customized.
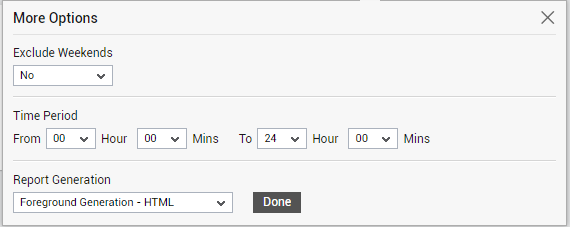
-
If the timeline specified for the report needs to exclude the data collected during the Weekends, then set Exclude weekends to Yes. If not, select No.
Note:
By default, the weekend constitutes Saturday and Sunday. To override this default setting, do the following:
- Edit the eg_report.ini file in the <EG_INSTALL_DIR>\manager\config directory.
- In the [EXCLUDE_WEEKEND] section of the file, the Days parameter is set to Saturday,Sunday by default. You can modify this by setting the Days parameter to a comma-separated list of other days of the week - say Friday,Saturday.
- Save the file after making the required changes.
-
Next, indicate the report Time period.
Note:
By default, the Time period is set to 24 hours. Accordingly, the From and To parameters in the [timeframe] section of the eg_report.ini file (in the <eg_install_dir>\manager\config directory) are set to 00:00 and 24:00 respectively. If need be, you can override this default setting by configuring a different timeframe against the From and/or To parameters.
-
In large environments, reports generated using months of data can take a long time to complete. Administrators now have the option of generating reports on-line or in the background. When a report is scheduled for background generation, administrators can proceed with their other monitoring, diagnosis, and reporting tasks, while the eG manager is processing the report. This saves the administrator valuable time. To schedule background processing of a report, you can either select the Background Save - PDF option from the Report Generation list. To process reports in the foreground, select the Foreground Generation - HTML option from this list.
Note:
- The Report Generation list will appear only if the EnableBackgroundReport flag in the [BACKGROUND_PROCESS] section of the eg_report.ini file (in the <EG_INSTALL_DIR>\manager\config directory) is set to Yes.
- The default selection in the Report Generation list will change according to the Timeline specified for the report. If the Timeline set is greater than or equal to the number of days specified against the MinDurationForReport parameter in the [BACKGROUND_PROCESS] section of the eg_report.ini file, then the default selection in the Report Generation list will be Background Save - PDF. On the other hand, if the Timeline set for the report is lesser than the value of the MinDurationForReport parameter, then the default selection in the Report Generation list will be Foreground. This is because, the MinDurationForReport setting governs when reports are to be processed in the background. By default, this parameter is set to 2 weeks - this indicates that by default, reports with a timeline of 2 weeks and above will be processed in the background.
- Click the Done button if any changes were made to the More Options drop down window.
- Finally, click the Run Report button to generate the report.
-
If the Report type is Foreground Generation - HTML, then Figure 3 will appear as soon as you click the Run Report button.
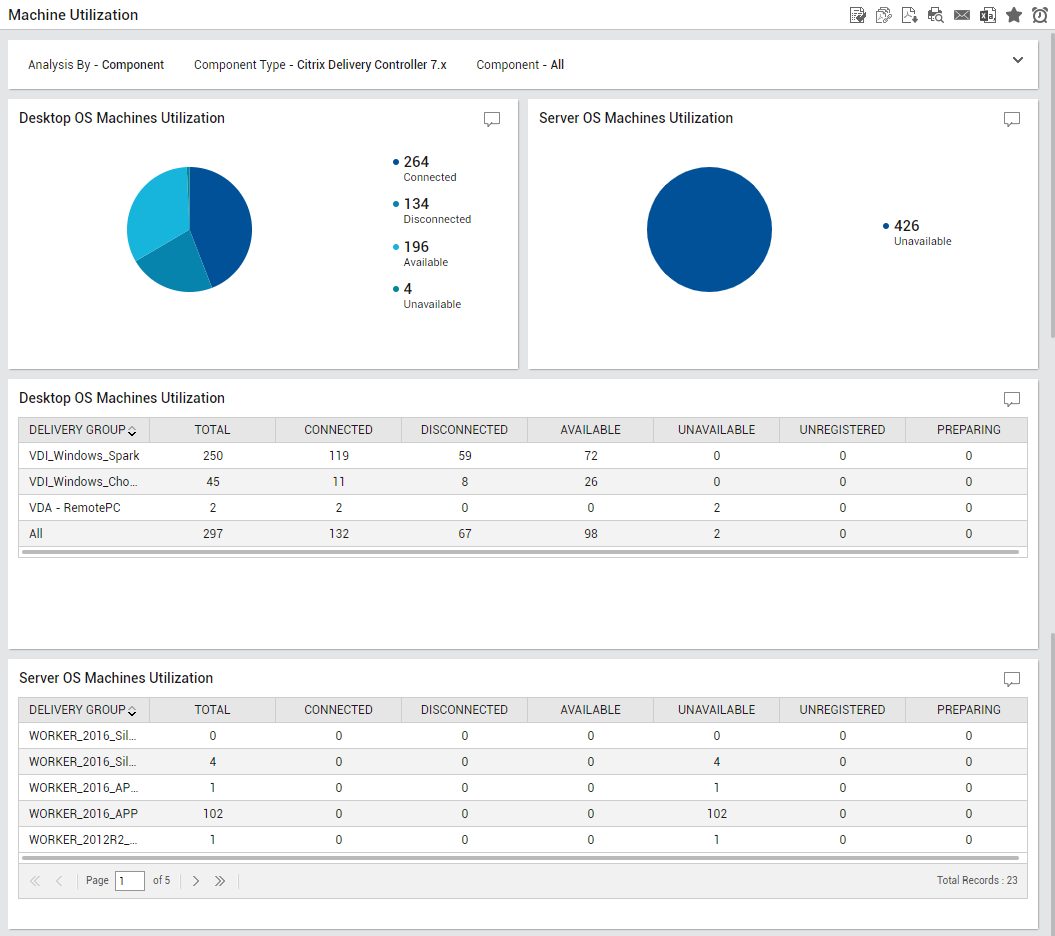
Figure 3 : The generated Machine Utilization Report
The generated report contains the following sections (see Figure 3):
- The Desktop OS Machines and the Server OS Machines sections reveal separate pie charts to shows the distribution of machines based on their current state i.e., connected, disconnected, available, unavailable etc. By merely looking at the ie chart administrators can figure out the state in which maximum number of machines are put up.
- The Desktop OS Machines Utilization and the Server OS Machines Utilization sections reveal the delivery groups that belong to the Desktop OS machines and the Server OS machines. For each delivery group, administrators can figure out the count of machines in each state. Using this report, administrators can figure out the delivery group in which most of the machines are in an abnormal state. Similarly, the over-utilized and under-utilized delivery groups too can be identified using this report.