Microsoft Teams - Service Health Report
As with any cloud-hosted service, service disruptions, downtime and slow connectivity issues are bound to affect business continuity and Microsoft Teams administrators require actionable insight to proactively alert them when performance starts to degrade and to help them resolve problems quickly. eG Enterprise helps Microsoft Teams administrators generate a Service Health report which throws light on health, connection status and the trend of packet loss noticed while calls were initiated by the users using the Microsoft Teams service over a period of time. This report also helps administrators in post-mortem analysis of the data which in turn would help administrators in understanding the pattern of Microsoft Teams performance problems.
To generate this report, do the following:
-
Follow the menu sequence: REPORTS BY FUNCTION -> Domain-specific Reports -> Office 365 Monitoring -> Microsoft Teams -> Service Health.
-
Figure 1 then appears. In Figure 1, select a criteria for analysis from the Analyze By list box.
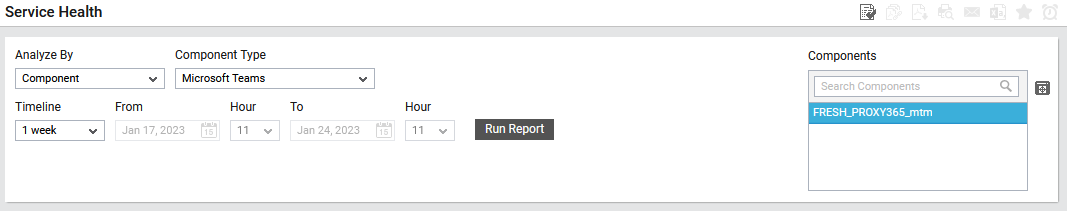
Figure 1 : Specifying the criteria for generating the Service Health report
-
Using this report, you can analyze the service health of one/more managed components, or those that are part of a zone, service or segment. The options provided by the Analyze By list box are discussed hereunder:
- Component: Select this option to choose the component(s) from across all the managed components in the environment.
- Zone: To generate a report for one/more components that are included in a zone, pick the Zone option. A Zone drop-down list will then appear, from which you would have to select the zone to which the components of interest to you belong. A Sub zone flag also appears. Indicate whether the components present within the sub-zones of the chosen zone are also to be to be considered for report generation, by setting the Sub zone flag to Yes.
- Segment: If you want to generate a report for one/more chosen components that belong to a segment, select the Segment option from Analyze By list box, and then pick the Segment from the drop-down list that appears.
- Service: If you want to generate a report for one/more components involved in the delivery of a service, select the Service option from Analyze By, and then pick the required Service from the drop-down list that appears.
-
Choose a Component Type for which the report is to be generated.
-
The Components list will now be populated with all the components that are managed in your environment for the chosen component type. If the Components list consists of too many components, then viewing all the components and selecting the ones you need for report generation could require endless scrolling. To avoid this, you can click the
 button next to the Components list. A Components pop up window will then appear using which you can view almost all the components in a single interface and Select the ones to be included in this report.
 -
Then, specify the Timeline for generating this report. You can either provide a fixed time line such as 1 hour, 2 days, etc., or select the Any option from the list to provide a From and To date/time for report generation.
Note:
For every user registered with the eG Enterprise system, the administrator can indicate the maximum timeline for which that user can generate a report. Once the maximum timeline is set for a user, then, whenever that user logs into eG Reporter and attempts to generate a report, the Timeline list box in the report page will display options according to the maximum timeline setting of that user. For instance, if a user can generate a report for a maximum period of 3 days only, then 3 days will be the highest option displayed in the Timeline list - i.e., 3 days will be the last option in the fixed Timeline list. Similarly, if the user chooses the Any option from the Timeline list and proceeds to provide a start date and end date for report generation using the From and To specifications, eG Enterprise will first check if the user's Timeline specification conforms to his/her maximum timeline setting. If not, report generation will fail. For instance, for a user who is allowed to generate reports spanning over a maximum period of 3 days only, the difference between the From and To dates should never be over 3 days. If it is, then, upon clicking the Run Report button a message box will appear, prompting the user to change the From and To specification.
-
In addition to the settings discussed above, this report comes with a set of default specifications. These settings are hidden by default. If you do not want to disturb these default settings, then you can proceed to generate the report by clicking the Run Report button soon after you pick one/more components for report generation. However, if you want to view and then alter these settings (if required), click on the
 icon. The default settings will then appear in the More Options drop down window (See Figure 2). The steps below discuss each of these settings and how they can be customized.
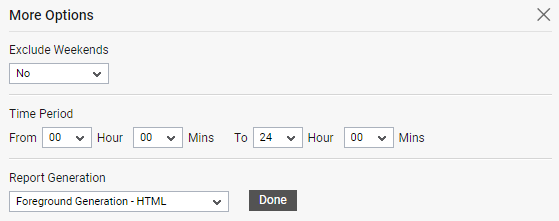
Figure 2 : The default settings for generating the Service Health report
-
If the timeline specified for the report needs to exclude the data collected during the Weekends, then set Exclude weekends to Yes. By default, this is set to No.
Note:
By default, the weekend constitutes Saturday and Sunday. To override this default setting, do the following:
- Edit the eg_report.ini file in the <EG_INSTALL_DIR>\manager\config directory.
- In the [EXCLUDE_WEEKEND] section of the file, the Days parameter is set to Saturday,Sunday by default. You can modify this by setting the Days parameter to a comma-separated list of other days of the week - say Friday,Saturday.
- Save the file after making the required changes.
-
Next, indicate the report Time period.
Note:
By default, the Time period is set to 24 hours. Accordingly, the From and To parameters in the [timeframe] section of the eg_report.ini file (in the <eg_install_dir>\manager\config directory) are set to 00:00 and 24:00 respectively. If need be, you can override this default setting by configuring a different timeframe against the From and/or To parameters.
-
In large environments, reports generated using months of data can take a long time to complete. Administrators now have the option of generating reports on-line or in the background. When a report is scheduled for background generation, administrators can proceed with their other monitoring, diagnosis, and reporting tasks, while the eG manager is processing the report. This saves the administrator valuable time. To schedule background processing of a report, you can either select the Background Save - PDF option from the Report Generation list. To process reports in the foreground, select the Foreground Generation - HTML option from this list.
Note:
- The Report Generation list will appear only if the EnableBackgroundReport flag in the [BACKGROUND_PROCESS] section of the eg_report.ini file (in the <EG_INSTALL_DIR>\manager\config directory) is set to Yes.
- The default selection in the Report Generation list will change according to the Timeline specified for the report. If the Timeline set is greater than or equal to the number of days specified against the MinDurationForReport parameter in the [BACKGROUND_PROCESS] section of the eg_report.ini file, then the default selection in the Report Generation list will be Background Save - PDF. On the other hand, if the Timeline set for the report is lesser than the value of the MinDurationForReport parameter, then the default selection in the Report Generation list will be Foreground. This is because, the MinDurationForReport setting governs when reports are to be processed in the background. By default, this parameter is set to 2 weeks - this indicates that by default, reports with a timeline of 2 weeks and above will be processed in the background.
-
Click the Done button if any changes were made to the More Options drop down window.
-
Finally, click the Run Report button to generate the report.
-
If the Report type is Foreground Generation - HTML, then Figure 3 will appear as soon as you click the Run Report button.
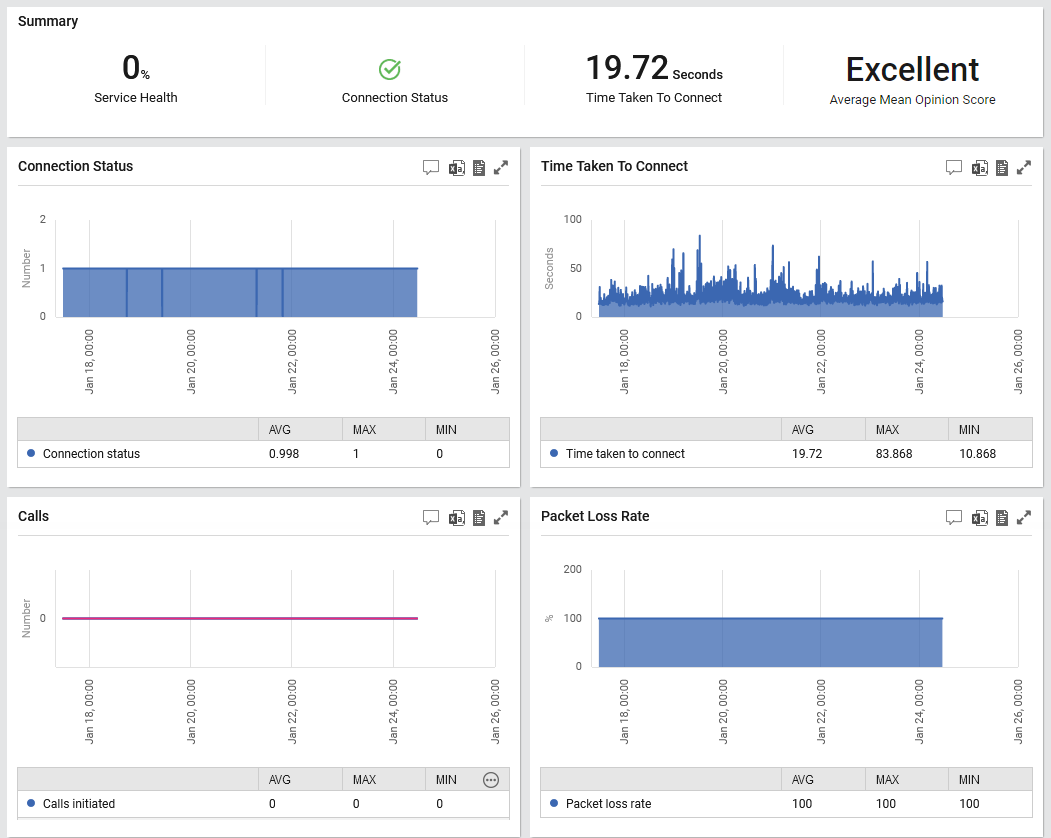
Figure 3 : The generated Service Health Report
The generated report (see Figure 3) contains the following sections:
-
The Summary section provides an at-a-glance view of overall health of the Microsoft Teams service, the count of service incidents and information registered in the Message Center Communication. This section also reveals the connection status to the portal and the average time taken for a user to login to the service.
The basis of all measures of voice quality is how a person perceives the quality of speech during a call. The Average Mean Opinion Score helps administrators historically gauge the user experience during Microsoft Teams calls.
-
With the help of Connection Status graph, you can analyze and study how the connection status of the Microsoft Teams was during the chosen time period. In the process, you can quickly figure out how often during the chosen time period, the connection status was down -i.e., connection to Microsoft Teams was lost. This way, the graph sheds light on connectivity issues that may have occurred in the past, but may have been missed/overlooked by administrators.
-
With the help of Time Taken to Connect graph, you can historically analyze how long did it take to connect to Microsoft Teams. In the process, you can figure out the exact time period during which connecting to Microsoft Teams took longer than usual. This way, this graph helps administrators figure out the pattern on when exactly the time taken to connect to Microsoft Teams was taking longer than usual and analyze the real cause behind such time delays.
-
The Calls graph helps administrators analyze the total calls initiated over a period of time, the calls that were completed and the calls that failed. Also, administrators can figure out the pattern on when exactly maximum number of call failures were noticed. This way, this graph sheds light on call failures that had occurred in the past and help administrators analyze the reason behind such call failures.
-
The Packet Loss Rate graph helps administrators identify when exactly maximum percentage of packets were lost during the chosen time period. This will help administrators identify the packet loss patterns and historically analyze the reason for packet loss.
-
Unplanned service incidents can impact service availability and responsiveness. To indicate if such incidents have occurred in the past, the Service Health page reports the service incidents in the History of Service Incidents/Advisories section. Using this section, you can figure out the pattern noticed in the occurrence of service incidents and the services that were impacted due to such service incidents.
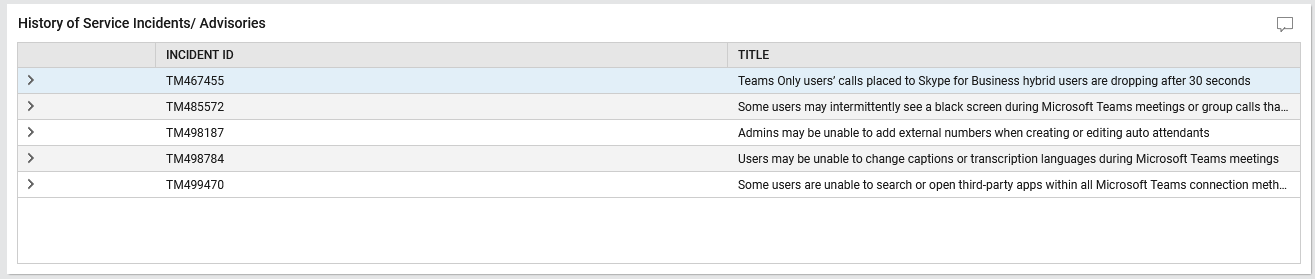
Figure 4 : The History of Service Incidents/Advisories section
Expanding a service incident offers the status of the incident, a brief message on the incident and the time at which the incident was lastly updated.
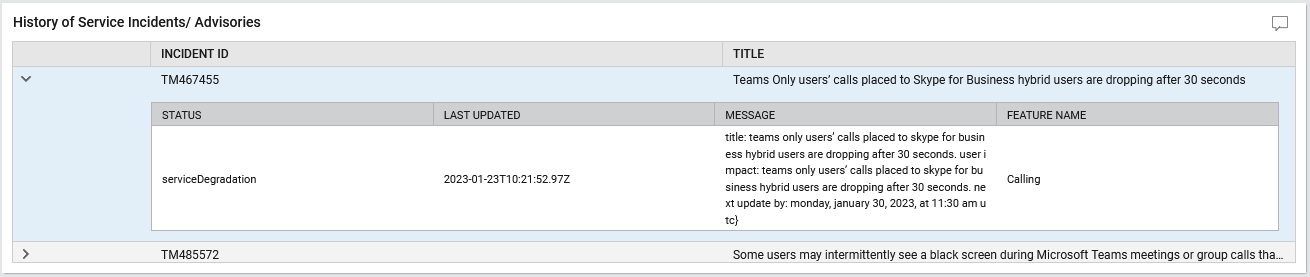
Figure 5 : Expanding a Service Incident/Advisory
-