Migration Assessment Report
In large, mission-critical environments with hundreds of hosts and VMs, a software/hardware migration is performed in large numbers on a day to day basis so that any impending service outages and performance degradations can be avoided. Administrators of such environments might therefore find it difficult to manually track the status of the migration activities, or accurately identify any performance improvements after the migration. The absence of a specialized software/hardware migration monitoring mechanism also renders the administrators unable to isolate resource-hungry hosts/servers and resource-deficient hosts/servers in the target environment.
To address these concerns, eG Reporter allows the generation of a specialized Migration Assessment Report. Using the graphical results provided by this report, administrators can perform the following:
- Easily observe and effectively analyze the migration activity over time, and understand how well migration has helped in improving the performance of the servers;
- Detect any performance implications and identify the reason for the same;
- Instantly identify whether the hosts/servers are capable of handling additional load after migration activity;
To view a Migration report, do the following:
-
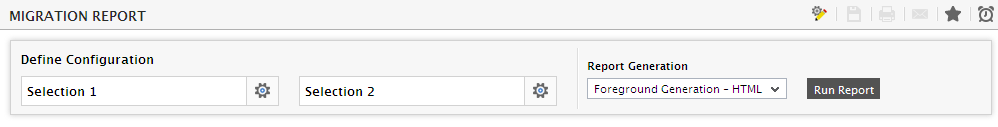
Select the Migration Assessment option from the Analytical Reports node of the REPORTS BY FUNCTION tree of the eG Reporter menu. Figure 1 will then appear.
-
Clicking the
 button against the Selection 1 option will lead you to Figure 2.
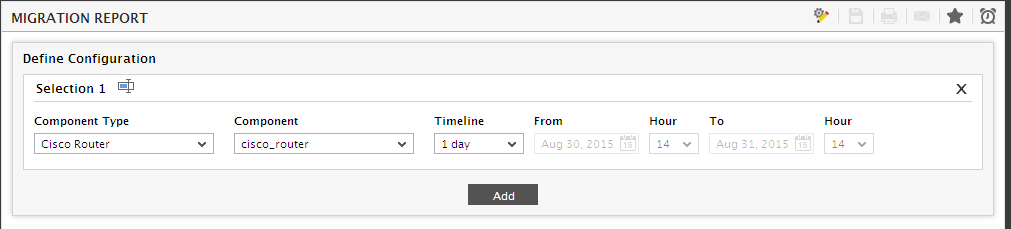
Figure 2 : Selecting a component for which the report is to be generated
- From Figure 2, select the Component Type and Component for which the report is to be generated.
-
Then, specify the Timeline for the graph. You can either provide a fixed time line such as 1 hour, 2 days, etc., or select the Any option from the list to provide a From and To date/time for report generation.
Note:
For every user registered with the eG Enterprise system, the administrator can indicate the maximum timeline for which that user can generate a report. Once the maximum timeline is set for a user, then, whenever that user logs into eG Reporter and attempts to generate a report, the Timeline list box in the report page will display options according to the maximum timeline setting of that user. For instance, if a user can generate a report for a maximum period of 3 days only, then 3 days will be the highest option displayed in the Timeline list - i.e., 3 days will be the last option in the fixed Timeline list. Similarly, if the user chooses the Any option from the Timeline list and proceeds to provide a start date and end date for report generation using the From and To specifications, eG Enterprise will first check if the user's Timeline specification conforms to his/her maximum timeline setting. If not, report generation will fail. For instance, for a user who is allowed to generate reports spanning over a maximum period of 3 days only, the difference between the From and To dates should never be over 3 days. If it is, then, upon clicking the Run Report button a message box will appear, prompting the user to change the From and To specification.
- Clicking the Add button will add your selection to Selection 1.
-
If you wish to change the label for Selection 1, then you can do so by clicking the
 icon.
icon. 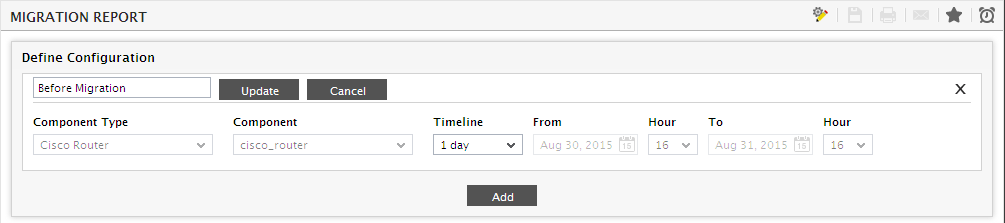
Figure 3 : Changing the label for Selection 1
- Entering the name of your choice and clicking the Update button will change the label of Selection 1.
- Follow the steps 3-5 to add a selection to Selection 2. The Component Type and Component chosen in Selection 1 will automatically apply to Selection 2. By default, the Timeline for Selection 2 is 1 day. If you wish to change the Timeline, then you can do so by selecting an appropriate Timeline of your choice. Clicking the Add button will add your selection to Selection 2.
-
To select the measures for which the report is to be generated, click the
 icon. Figure 4 will then appear.
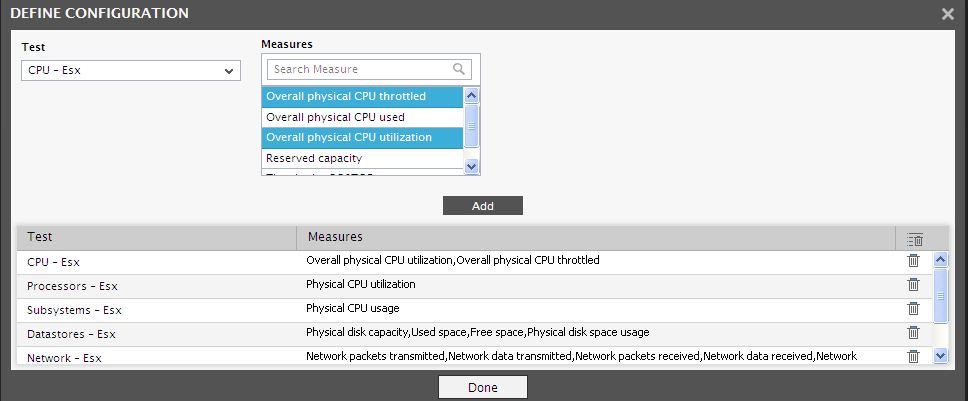
- From Figure 4, select a Test and Measure for which the report is to be generated. Clicking the Add button will populate your selection in the section below. By default, a set of default tests and measures for which the report will be generated is displayed in this section as shown in Figure 4. If you wish to delete a set of test and measure, then you can do so by clicking the
 icon against each Test-Measure combination.
 - Once the selection criterion is chosen, click the Done button. This will lead you back to Figure 1.
-
In large environments, reports generated using months of data can take a long time to complete. Administrators now have the option of generating reports on-line or in the background. When a report is scheduled for background generation, administrators can proceed with their other monitoring, diagnosis, and reporting tasks, while the eG manager is processing the report. This saves the administrator valuable time. To schedule background processing of a report, select the Background Save - PDF option from the Report Generation list. In this case, a Report Name text box will appear, where you would have to provide the name with which the report is to be saved in the background. To process reports in the foreground, select the Foreground Generation - HTML option from this list.
Note:
- The Report Generation list will appear only if the EnableBackgroundReport flag in the [BACKGROUND_PROCESS] section of the eg_report.ini file (in the [EG_INSTALL_DIR]\manager\config directory) is set to Yes.
- The default selection in the Report Generation list will change according to the Timeline specified for the report. If the Timeline set is greater than or equal to the number of days specified against the MinDurationForReport parameter in the [BACKGROUND_PROCESS] section of the eg_report.ini file, then the default selection in the Report Generation list will be Background Save - PDF. On the other hand, if the Timeline set for the report is lesser than the value of the MinDurationForReport parameter, then the default selection in the Report Generation list will be Foreground. This is because, the MinDurationForReport setting governs when reports are to be processed in the background. By default, this parameter is set to 2 weeks - this indicates that by default, reports with a timeline of 2 weeks and above will be processed in the background.
-
Finally, clicking the Run Report will generate the report.
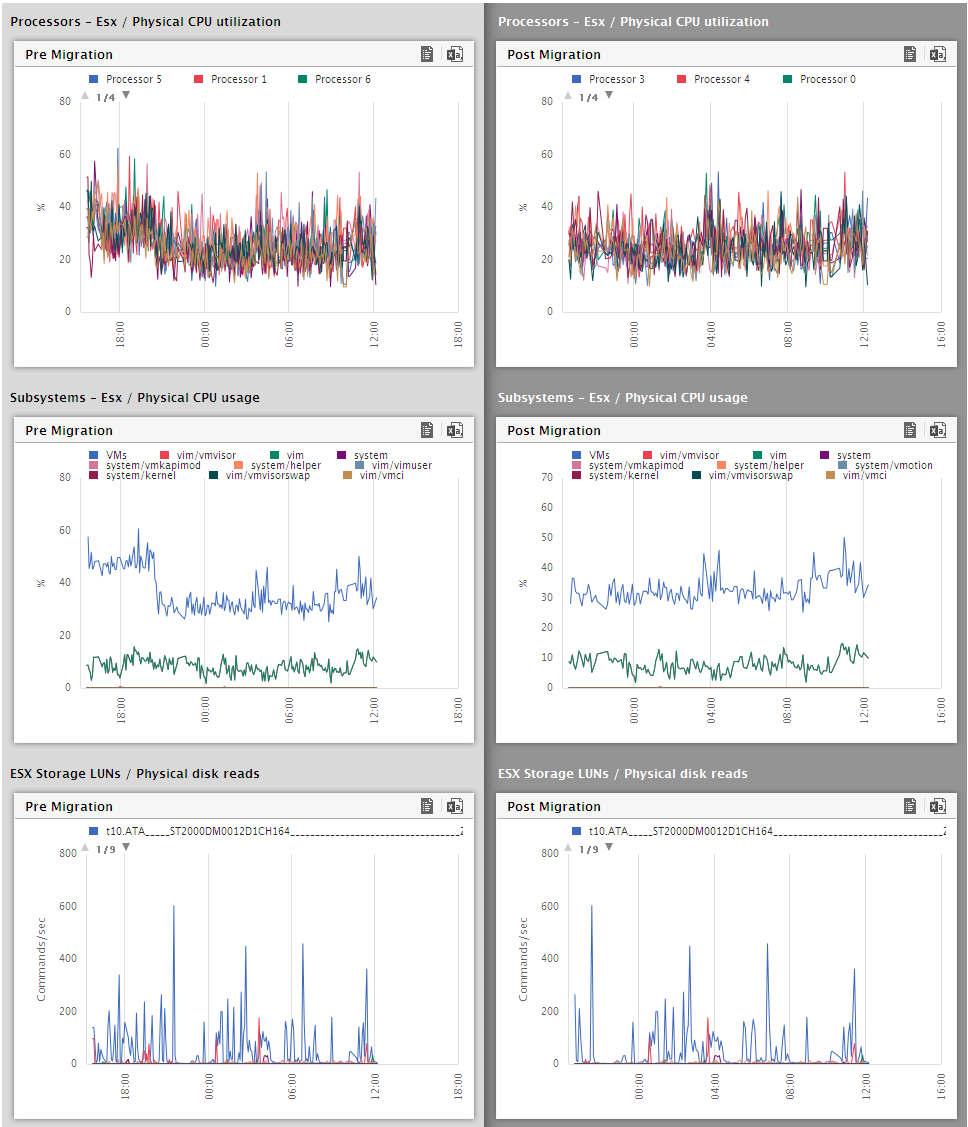
- The resulting report will consist of two graphical columns - a graphical representation of the measures pertaining to Selection 1 and a graphical representation of the measures for Selection 2. From Figure 5, you could note that the graphs for certain measures are descriptor-based.
-
In the case of measures that take descriptors, Figure 5 will be able to display a maximum of 10 descriptors in one graph, by default.
Note:
The maximum number of descriptors that can be displayed in the MIGRATION REPORTpage is configurable. For that, set the MaxInfos parameter in the [INFOS] section of the eg_report.ini (in the <EG_INSTALL_DIR>\manager\config directory) to the required value. By default, this parameter will be set to 10, indicating that a maximum of 10 descriptors can be plotted in a single graph in the MIGRATION REPORTpage.
-
By generating this report, administrators may be able to analyze the performance of the server/component before and after migration, figure out the improvement/degradation in the performance of the server/component and deduce whether/not the server/component is capable of handling additional load after the migration process.
Note:
- Selecting the same Component for both Selection 1 and Selection 2will provide you with a meaningful report.
- This report can be generated for different Timelines – it is not mandatory to select the same Timeline for both Selection 1 and Selection 2.