Prediction Analysis Report
Prediction Analysis Report analyzes the history of metrics and provide a prediction for the future. A Prediction Analysis Report applies built-in prediction mechanisms and sophisticated forecasting techniques on historical data for a metric to automatically compute how that metric is likely to change in the future. The result is a graph where historical data and future predictions are both plotted together.
With the help of Prediction Analysis Report, administrators can:
- Clearly understand how load was and how it will change in the future;
- Accurately determine when in the future the current resource capacity of the targets may get exhausted or may be inadequate; this information will enable you to re-evaluate your capacity plans and make sizing changes, so as to provide for such contingencies.
- Isolate the exact times in the future when the overall performance of a target will dip, and also figure out how poorly the targets may perform during such times; potential threats to good health are thus revealed, and efforts to avert them can be initiated early.
Note:
The reliability of the predictions revealed by the Prediction Analysis Report depends upon the historical data that is used as the basis for the predictions. If the historical data under consideration exhibits many variations and is highly deviating with frequent surges and dips, the prediction reports will consider only the average of the past performance and accordingly forecast future performance. In such predictions therefore, you may not be able to find distinct high or low performance points.
To generate the Prediction Analysis Report, do the following:
-
Select the Prediction Analysis option from the Analytical Reports node of the REPORTS BY FUNCTION tree in eG Reporter.
Note:
By default, the Capacity Planning option will not be available in the eG Reporter menu - i.e., users are not allowed to configure/generate capacity planning reports by default. To enable the generation of capacity planning and prediction reports, do the following:
- Edit the eg_services.ini file in the <EG_INSTALL_DIR>\manager\config directory.
- In the [misc_args] section of the file, you will find a CapacityReportEnabled flag, which is set to false by default. Change this flag to true.
- Save the file.
-
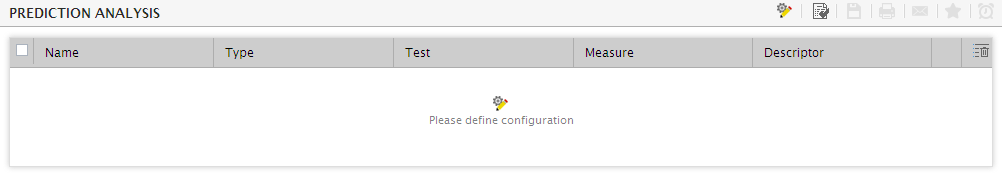
Figure 1 will then appear.
-
Click on the Please define configuration link in Figure 1 to choose the measures for generating the Prediction Analysis reports. Figure 2 will then appear.
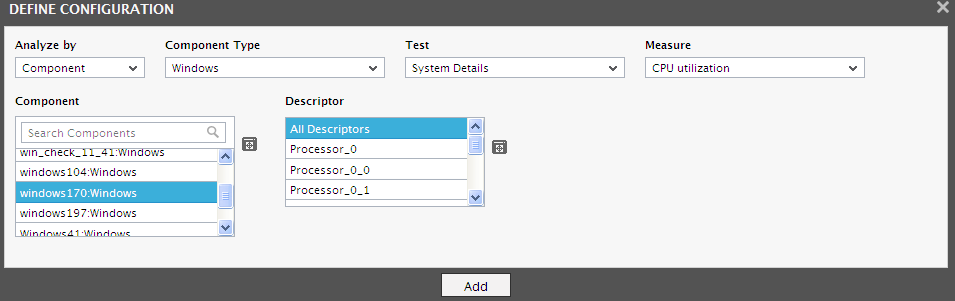
Figure 2 : Defining the configuration for generating the Prediction Analysis report
-
Pick a criterion for analysis from the Analyze by list. Using this report, you can predict the future performance of independent components and those that are part of a segment, service, or a zone. The options provided by the Analyze by list box are discussed hereunder:
- Component: Select this option to choose the component(s) from across all the managed components in the environment.
- Service: Select this option if the components for which a report is to be generated are involved in the delivery of a business service. Then, select a Service.
- Segment: Choose this option if the components for which this report is to be generated are part of a segment. Then, pick a Segment for analysis.
- Zone: Pick this option for a capacity planning report for components that are part of a zone. Then, choose a Zone. Also, indicate whether the components within the sub-zones of the chosen zone are also to be to be considered for report generation, by selecting an option from the Include subzone list.
- Based on the criterion chosen from the Analyze by list, the Component Type list will be populated. Select a component type for which the report is to be generated.
- Of the tests associated with the chosen component-type, select the Test to which this report should pertain.
- From the Measure list, choose the measures for which this report is to be generated.
- All components of the chosen type spread across the environment, or which are within a chosen segment / service / zone (based on the Analyze by selection) will be listed in the Component list. Pick the components for which the report is to be generated. If the Component list consists of too many components, then viewing all the components and selecting the ones you need for report generation could require endless scrolling. To avoid this, you can click the
 button next to the Component list. The COMPONENT pop up window will then appear using which you can view almost all the components in a single interface and Select the ones for which the report is to be generated.
 -
Select the descriptors of interest from the Descriptor list; to include all descriptors in the analysis, select the All descriptors option.
Note:
The Descriptors list will be populated with descriptors only if a single component is chosen from the Components list. If multiple components are chosen, no descriptors will be displayed here for selection.
- If the Descriptor list consists of too many descriptors, then viewing all the descriptors and selecting the ones you need for report generation could require endless scrolling. To avoid this, you can click the button next to the Descriptor list. The DESCRIPTOR pop up window will then appear using which you can view almost all the descriptors in a single interface and select the ones for which the report is to be generated.
-
Then, click the Add button. The specification that you built will be added to the box as shown in Figure 3. Similarly, multiple specifications can be added. To remove a specification, simply select the check box corresponding to that row in the box, and click the
 button. To remove all specifications listed in the box, just select the check box before the column head Name so that, all listed specifications are marked for deletion;then, click the button.
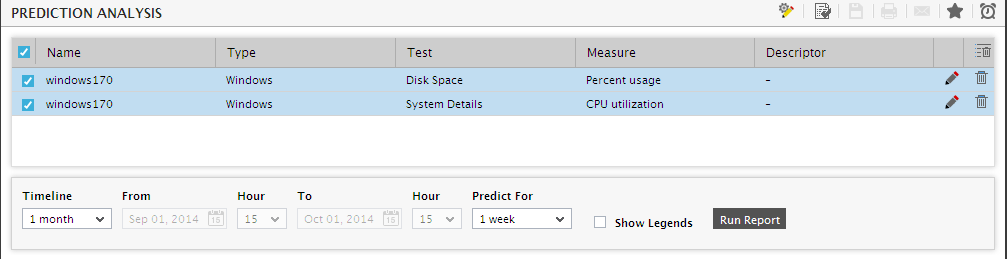
-
If your specification includes one or more descriptors, you can modify your specification by clicking the
 button. Figure 4 will then appear.
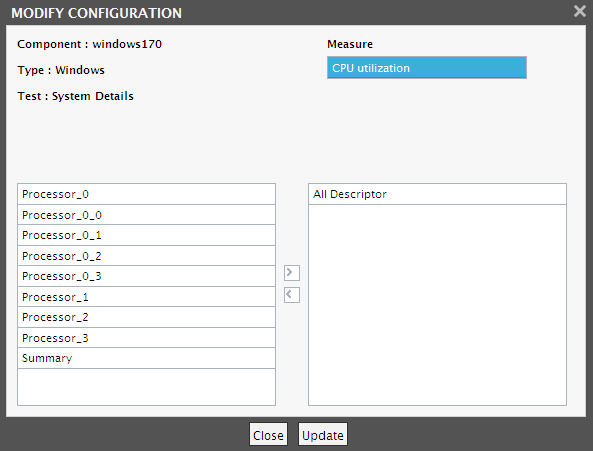
- To add more descriptors, select one/more options from the Excluded Descriptors list in Figure 4 and click the > button. To remove descriptors, select one/more options from the Included Descriptors list and click the < button. Finally, click the Update button.
- Also, the Measure list in Figure 4 will display all the measures for the chosen test, and will indicate which ones have been chosen for report generation. If you want to exclude one/more measures, simply deselect the measures from the Measure list, and finally, click the Update button.
-
This will lead you back to the report page. Here, provide a Timeline for the report.
Note:
For every user registered with the eG Enterprise system, the administrator can indicate the maximum timeline for which that user can generate a report. Once the maximum timeline is set for a user, then, whenever that user logs into eG Reporter and attempts to generate a report, the Timeline list box in the report page will display options according to the maximum timeline setting of that user. For instance, if a user can generate a report for a maximum period of 3 days only, then 3 days will be the highest option displayed in the Timeline list - i.e., 3 days will be the last option in the fixed Timeline list. Similarly, if the user chooses the Any option from the Timeline list and proceeds to provide a start date and end date for report generation using the From and To specifications, eG Enterprise will first check if the user's Timeline specification conforms to his/her maximum timeline setting. If not, report generation will fail. For instance, for a user who is allowed to generate reports spanning over a maximum period of 3 days only, the difference between the From and To dates should never be over 3 days. If it is, then, upon clicking the Run Report button a message box will appear, prompting the user to change the From and To specification.
-
In addition to the settings discussed above, this report comes with a set of default specifications. These settings are hidden by default. If you do not want to disturb these default settings, then you can proceed to generate the report by clicking the Run Report button soon after you pick the criteria for generating the report. However, if you want to view and then alter these settings (if required), click on the
 icon. The default settings will then appear in the MORE OPTIONS drop down window (see Figure 5). The steps below discuss each of these settings and how they can be customized.
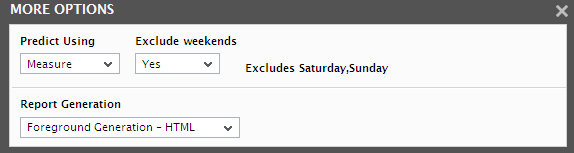
Figure 5 : The default settings for generating a Prediction Analysis report
-
Next, from the Predict Using list (see Figure 6), pick the criterion using which the predictions need to be performed. You can choose from the following options:
- Measure: If this option is chosen, then the resulting report will plot time-of-day variations in a chosen measure during the past timeline that you provide; in addition, the report will also plot the expected time-of-day variations in that measure during the future timeline that you specify. This option is ideal for measures where you need to closely observe the variations in order to accurately judge future performance.
- Min Trend: Select this option if the report should indicate only the minimum values registered by the measure during the past timeline, and how low the measure value can go in the future. This option is ideal for measures such as Free space or Free memory, where low values are a cause for concern. Using the Min Trend report in such cases will enable you to ascertain whether space/memory usage will hit alarming levels in the future; with the help of the warning signals sent out by such a prediction report, you can size your systems and servers adequately, so as to avoid such adversities.
- Max Trend: Select this option if the report should indicate only the maximum values registered by the measure during the specified past timeline, and how high the measure can reach in the future. This option is ideal for measures such as Disk busy or Disk space usage, where high values often indicate a problem condition. Using the Max Trend report in such cases will enable you to ascertain whether disk space/activity will hit alarming levels in the future; with the help of the warning signals sent out by such a prediction report, you can size your systems and servers adequately, so as to avoid such adversities.
- Average: Select this option if the resulting report should indicate how the measure has been performing, on an average, in the past, and how the average performance will be in the future. Such an option is best suited for measures (such as CPU utilization), where you need to clearly distinguish between a sporadic failure and a steady deterioration in performance. The findings from such a report will lead you to potential issues so that, you can quickly initiate preventive action.
- If the timeline specified for the report needs to exclude the data collected during the Weekends, then set Exclude weekends to Yes. If not, select No.
- Next, from the Predict for list, choose a future timeline for prediction. The resulting graphs will then plot performance forecasts for the chosen timeline. You can predict for a future timeline ranging from 1 week to 1 month.
-
In large environments, reports generated using months of data can take a long time to complete. Administrators now have the option of generating reports on-line or in the background. When a report is scheduled for background generation, administrators can proceed with their other monitoring, diagnosis, and reporting tasks, while the eG manager is processing the report. This saves the administrator valuable time. To schedule background processing of a report, select the Background Save - PDF option from the Report Generation list. In this case, a Report Name text box will appear, where you would have to provide the name with which the report is to be saved in the background. To process reports in the foreground, select the Foreground Generation - HTML option from this list.
Note:
- The Report Generation list will appear only if the EnableBackgroundReport flag in the [BACKGROUND_PROCESS] section of the eg_report.ini file (in the {EG_INSTALL_DIR}\manager\config directory) is set to Yes.
- The default selection in the Report Generation list will change according to the Timeline specified for the report. If the Timeline set is greater than or equal to the number of days specified against the MinDurationForReport parameter in the [BACKGROUND_PROCESS] section of the eg_report.ini file, then the default selection in the Report Generation list will be Background. On the other hand, if the Timeline set for the report is lesser than the value of the MinDurationForReport parameter, then the default selection in the Report Generation list will be Foreground. This is because, the MinDurationForReport setting governs when reports are to be processed in the background. By default, this parameter is set to 2 weeks - this indicates that by default, reports with a timeline of 2 weeks and above will be processed in the background.
- Finally, click the Run Report button to generate the report.
-
If the Foreground Generation - HTML option is chosen from the Report Generation list, then, Figure 6 will appear as soon as the Run Report button is clicked.
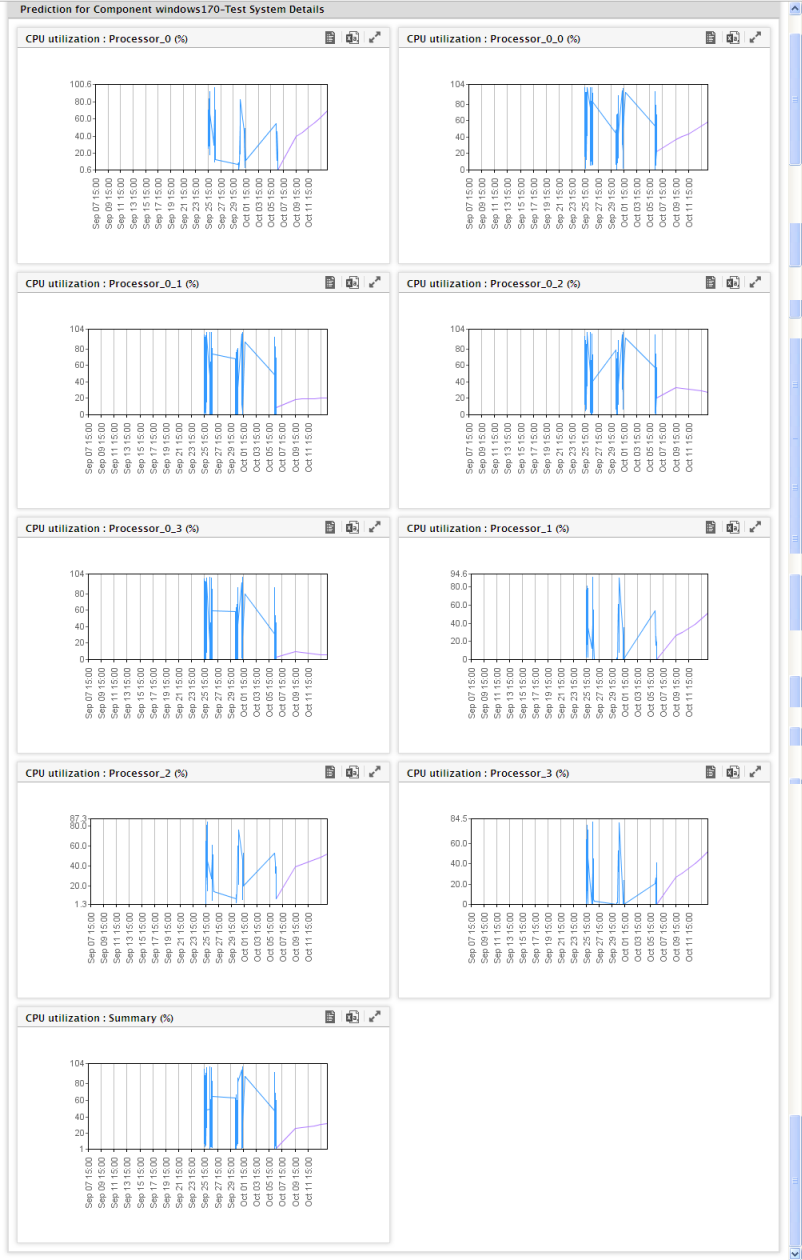
- Figure 6 provides separate sections for each component-test combination that you have chosen. Under each section, you will find individual graphs for every measure and descriptor chosen. Each of these graphs will not only indicate the variations in the values reported by the chosen measure during the past Timeline that you have selected, but will also plot auto-computed forecasts for the future timeline chosen from the Predict for list. These future predictions will enable you to pinpoint when in the future performance will peak or hit a low ebb; you can then plan the capacity of your environment or resize critical targets (if required), to avert the anticipated adversities.
- Click on a graph to enlarge it.
- Each graph displayed in Figure 6 will be accompanied by a
 button and a
  button. Clicking on the button at the right, top corner of a graph will enable you to view the data plotted in the graph, and clicking on the button next to it will enable you to save that graph as a CSV file.
 - If the Background Save - PDF option is chosen from the Report Generation list, then clicking on the Run Report button will not generate the report and display it in this page for your benefit. Instead, a message indicating that the report is being processed in the background will appear. This will be accompanied by a link that will lead you to the page that lists all the reports that are being processed in the background, and their current status. If background report generation fails for a report, you can regenerate that report using this page, or can even delete that report if need be. On the other hand, if background processing successfully completes for your report, then, you can view a PDF of the report by clicking on the
 icon in that page.