Real User Monitoring - Load Time Analysis Report
Whenever a user is asked to rate his/her overall experience with a particular web site/web application he/she may not only consider the look and feel of the site/application but also considers the ease of use of the site/application as well as the load time of the site/application. If the web site/web application takes longer than usual to load, then the user may be frustrated with the site/application and will visit the web site/web application less often. From a strictly user perspective, the user experience towards a web site/web application should be the same irrespective of using different devices/browsers, being in different geographic locations, accessing different page types/page groups etc. Viewing from an administrator perspective, if the user experience is uniform irrespective of accessing the web site/web application using different browsers/devices, being in geographic locations etc., he/she may consider that the overall performance of the site/application is satisfactory. The Load Time Distribution report offered by the eG Enterprise helps administrators analyze the overall performance of the web site/web application in the recent past from a multidimensional perspective.
For example, when an e-commerce web site/web application administrator receives enormous complaints from the users across the world regarding slowness of the site/application when a particular browser is used, it is the onus of the administrator to figure out the exact cause of such slowness. By generating the Load Time Distribution report, administrators can figure out the answers to the following questions:
- Which are the browsers that are causing hindrance leading to a poor user experience?
- Why is the response too early when a particular browser is used?
- Which browsers took too long to load?
- How many users are impacted due to such slow/fast response?
- Is there any abnormal error pattern noticed when the report is generated for different time periods?
- Are there too many users trying to access the web site/web application using a particular browser? or an error in the browser has caused a sudden raise in the number of users?
To generate the Load Time Distribution report for the above-mentioned scenario, do the following:
- Login to eG Reporter.
- Follow the menu sequence: REPORTS BY FUNCTION -> RUM Reports -> Load Time Distribution.
-
Figure 1 will then appear.
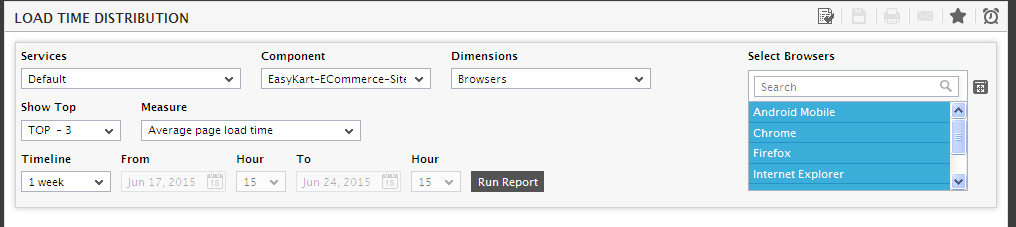
- Select the service for which the report is to be generated from the Service list box.
- Select a Component that is associated with the chosen Service and for which you wish this report to be generated.
- Selecting an option from the Dimensions list will help you to generate the report based on the chosen perspective. In our example, we need to choose the Browsers option.
- By default, the report provides the details of only the Top-3 chosen dimension in the chosen Component. You can choose a different top-n option from the Show Top list, if need be.
- Select the measure from the Measure list using which you wish to generate this report.
-
Provide a report Timeline. You can either select a fixed timeline such as 1 hour, 2 days, etc., or choose the Any option from the Timeline list, and then provide a From and To date/time for report generation.
Note:
For every user registered with the eG Enterprise system, the administrator can indicate the maximum timeline for which that user can generate a report. Once the maximum timeline is set for a user, then, whenever that user logs into eG Reporter and attempts to generate a report, the Timeline list box in the report page will display options according to the maximum timeline setting of that user. For instance, if a user can generate a report for a maximum period of 3 days only, then 3 days will be the highest option displayed in the Timeline list - i.e., 3 days will be the last option in the fixed Timeline list. Similarly, if the user chooses the Any option from the Timeline list and proceeds to provide a start date and end date for report generation using the From and To specifications, eG Enterprise will first check if the user's Timeline specification conforms to his/her maximum timeline setting. If not, report generation will fail. For instance, for a user who is allowed to generate reports spanning over a maximum period of 3 days only, the difference between the From and To dates should never be over 3 days. If it is, then, upon clicking the Run Report button a message box will appear, prompting the user to change the From and To specification.
-
In addition to the settings discussed above, this report comes with a set of default specifications. These settings are hidden by default. If you do not want to disturb these default settings, then you can proceed to generate the report by clicking the Run Report button soon after you pick a Measure. However, if you want to view and then alter these settings (if required), click on the
 icon. The default settings will then appear in the MORE OPTIONS drop down window (see Figure 2). The steps below discuss each of these settings and how they can be customized.
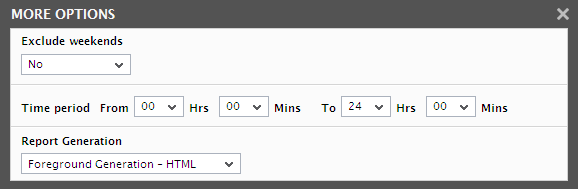
Figure 2 : The default settings for generating a Load Time Distribution report
-
If the timeline specified for the report needs to exclude the data collected during the Weekends, then set Exclude weekends to Yes. If not, select No.
Note:
By default, the weekend constitutes Saturday and Sunday. To override this default setting, do the following:
- Edit the eg_report.ini file in the <EG_INSTALL_DIR>\manager\config directory.
- In the [RUM_REPOTRS] section of the file, the EXCLUDE_WEEKEND parameter is set to Saturday, Sunday by default. You can modify this by setting the EXCLUDE_WEEKEND parameter to a comma-separated list of other days of the week - say Friday, Saturday.
- Save the file after making the required changes.
- Next, specify the start time and end time for report generation against the Time period field.
-
In large environments, reports generated using months of data can take a long time to complete. Administrators now have the option of generating reports on-line or in the background. When a report is scheduled for background generation, administrators can proceed with their other monitoring, diagnosis, and reporting tasks, while the eG manager is processing the report. This saves the administrator valuable time. To schedule background processing of a report, select the Background Save - PDF option from the Report Generation list. In this case, a Report Name text box will appear, where you would have to provide the name with which the report is to be saved in the background. To process reports in the foreground, select the Foreground Generation - HTML option from this list.
Note:
- The Report Generation list will appear only if the EnableBackgroundReport flag in the [BACKGROUND_PROCESS] section of the eg_report.ini file (in the [EG_INSTALL_DIR]\manager\config directory) is set to Yes.
- The default selection in the Report Generation list will change according to the Timeline specified for the report. If the Timeline set is greater than or equal to the number of days specified against the MinDurationForReport parameter in the [BACKGROUND_PROCESS] section of the eg_report.ini file, then the default selection in the Report Generation list will be Background. On the other hand, if the Timeline set for the report is lesser than the value of the MinDurationForReport parameter, then the default selection in the Report Generation list will be Foreground. This is because, the MinDurationForReport setting governs when reports are to be processed in the background. By default, this parameter is set to 2 weeks - this indicates that by default, reports with a timeline of 2 weeks and above will be processed in the background.
-
Finally, click the Run Report button to generate the report.
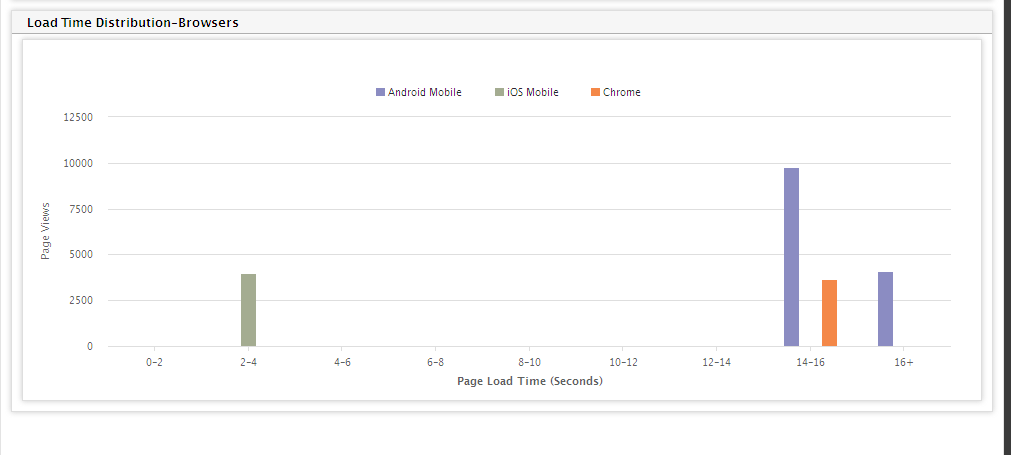
- Figure 3 will then appear. An ideal Load Time Distribution chart should always be complaint with the Apdex score i.e., the users should be able to view the web site/web application within 4 seconds. In other words, the page views should decrease drastically with an increase in time intervals for an ideal Load Time Distribution chart. In our example, users using the Android Mobile browser have experienced severe slowdowns indicating that they were made to wait for more than 14 seconds for the web site/web application to load. In addition, administrators can view that most of the page views are generated from the Android Mobile which implies that the web site/web application is very slow for most of the users accessing it. By generating this report, administrators can view at a single glance that their web site/web application is performing poor when Android mobile and Chrome browsers are used and only a very few users using iOS browsers are able to access the web site/web application fast.