Real User Monitoring - Service Level Report
In real time environments, administrators may be interested in understanding where exactly his/her web site/web application performance is heading on a day-to-day basis. The administrators may also want to figure out if the performance of his/her web site/web application is consistent across all days or is there a sudden dip/surge in the performance. To cater to the needs of such administrators, eG Enterprise provides an exclusive Service Level report that helps them generate the overall performance report on a daily/weekly/monthly basis.
To generate a Service Level report, do the following:
- Login to eG Reporter.
- Follow the menu sequence: REPORTS BY FUNCTION -> RUM Reports -> Service Level.
-
Figure 1 will then appear.
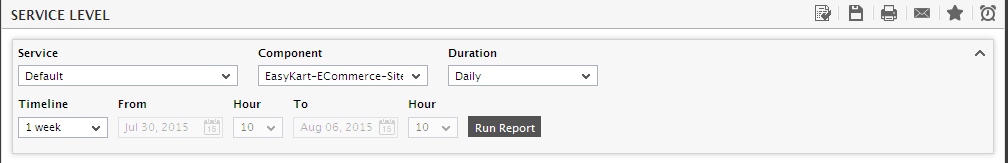
- Select the service for which the report is to be generated from the Service list box.
- Select a Component that is associated with the chosen Service and for which you wish to generate the report.
- If you wish to obtain day wise break up of the report, then select Daily option from the Duration List. If you wish to view a monthly report, then select Monthly from this list. By default, the Daily option is chosen from the Duration list.
-
Provide a report Timeline. You can either select a fixed timeline such as 1 hour, 2 days, etc., or choose the Any option from the Timeline list, and then provide a From and To date/time for report generation.
Note:
For every user registered with the eG Enterprise system, the administrator can indicate the maximum timeline for which that user can generate a report. Once the maximum timeline is set for a user, then, whenever that user logs into eG Reporter and attempts to generate a report, the Timeline list box in the report page will display options according to the maximum timeline setting of that user. For instance, if a user can generate a report for a maximum period of 3 days only, then 3 days will be the highest option displayed in the Timeline list - i.e., 3 days will be the last option in the fixed Timeline list. Similarly, if the user chooses the Any option from the Timeline list and proceeds to provide a start date and end date for report generation using the From and To specifications, eG Enterprise will first check if the user's Timeline specification conforms to his/her maximum timeline setting. If not, report generation will fail. For instance, for a user who is allowed to generate reports spanning over a maximum period of 3 days only, the difference between the From and To dates should never be over 3 days. If it is, then, upon clicking the Run Report button a message box will appear, prompting the user to change the From and To specification.
-
In addition to the settings discussed above, this report comes with a set of default specifications. These settings are hidden by default. If you do not want to disturb these default settings, then you can proceed to generate the report by clicking the Run Report button soon after you pick a Measure. However, if you want to view and then alter these settings (if required), click on the
 icon. The default settings will then appear in the MORE OPTIONS drop down window (see Figure 2). The steps below discuss each of these settings and how they can be customized.
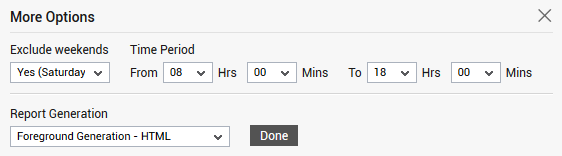
Figure 2 : The default settings for generating a Service Level report
-
If the timeline specified for the report needs to exclude the data collected during the Weekends, then set Exclude weekends to Yes. If not, select No.
Note:
By default, the weekend constitutes Saturday and Sunday. To override this default setting, do the following:
- Edit the eg_report.ini file in the <EG_INSTALL_DIR>\manager\config directory.
- In the [RUM_REPOTRS] section of the file, the EXCLUDE_WEEKEND parameter is set to Saturday,Sunday by default. You can modify this by setting the EXCLUDE_WEEKEND parameter to a comma-separated list of other days of the week - say Friday, Saturday.
- Save the file after making the required changes.
- Next, specify the start time and end time for report generation against the Time period field.
-
In large environments, reports generated using months of data can take a long time to complete. Administrators now have the option of generating reports on-line or in the background. When a report is scheduled for background generation, administrators can proceed with their other monitoring, diagnosis, and reporting tasks, while the eG manager is processing the report. This saves the administrator valuable time. To schedule background processing of a report, select the Background Save - PDF option from the Report Generation list. In this case, a Report Name text box will appear, where you would have to provide the name with which the report is to be saved in the background. To process reports in the foreground, select the Foreground Generation - HTML option from this list.
Note:
- The Report Generation list will appear only if the EnableBackgroundReport flag in the [BACKGROUND_PROCESS] section of the eg_report.ini file (in the [EG_INSTALL_DIR]\manager\config directory) is set to Yes.
- The default selection in the Report Generation list will change according to the Timeline specified for the report. If the Timeline set is greater than or equal to the number of days specified against the MinDurationForReport parameter in the [BACKGROUND_PROCESS] section of the eg_report.ini file, then the default selection in the Report Generation list will be Background. On the other hand, if the Timeline set for the report is lesser than the value of the MinDurationForReport parameter, then the default selection in the Report Generation list will be Foreground. This is because, the MinDurationForReport setting governs when reports are to be processed in the background. By default, this parameter is set to 2 weeks - this indicates that by default, reports with a timeline of 2 weeks and above will be processed in the background.
-
Finally, click the Run Report button to generate the report. Figure 3 will then appear.
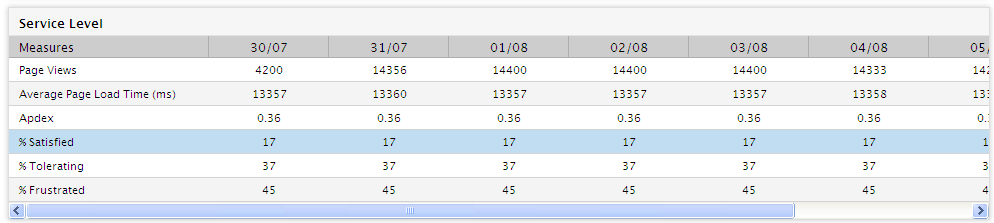
Figure 3 : The Service Level Report generated when Daily option is chosen from the Duration list
- If the Daily option is chosen from the Duration list, then the report will provide you with a service level overview showing key metrics of your interest. For example, if you are generating the report on 30th July 2015 at 10.00 hours, then the report will be generated from 10.00 hours of 30th July 2015 to 10.00 hours of 6th August 2015.
-
If you wish to view a pictorial representation of any measures that are displayed in Figure 12.3, then you can do so by clicking the measure of your choice. will then appear displaying a bar graph for the corresponding measure for the chosen timeline.
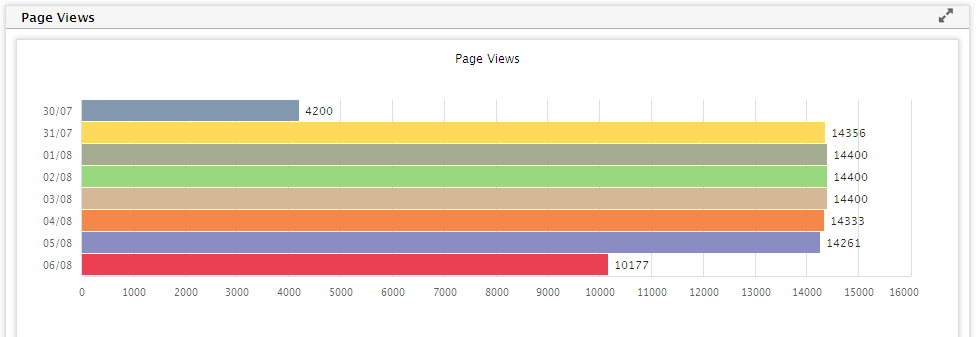
Figure 4 : The bar graph that appears upon clicking a measure from the Service Level report
-
If the Monthly option is chosen from the Duration list, then a monthwise report will be generated which helps administrators to analyze the overall performance of the web site/web application during that period of time and figure out the user experience to the web site/web application during that chosen month.
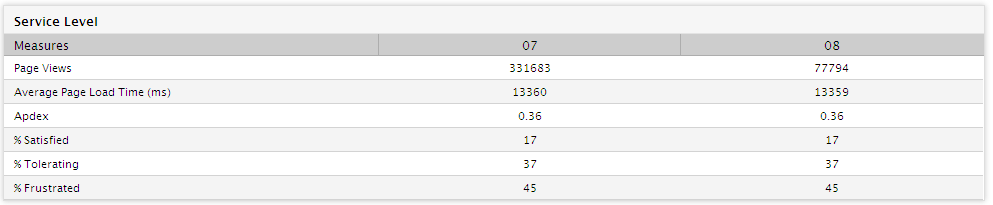
Figure 5 : The Service Level Report generated when Monthly option is chosen from the Duration list