Service Level Analysis - By Zone Reports
Using the Service Level Analysis - By Zone reports, an executive can receive a broad idea about the performance of a particular zone during a specific period.
To generate this report, do the following:
- Select the By Zone option from the Service Level Analysis sub node available under the Executive Reports node of the REPORTS BY FUNCTION tree.
-
From the Zone list box in the page that appears next (see Figure 1), select the zone for which the report needs to be generated.
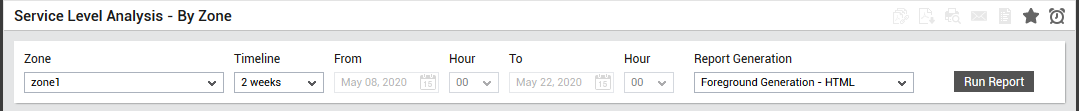
Figure 1 : Generating a Service Level Analysis - By Zone Report
-
Provide a Timeline for the report. You can either provide a fixed time line such as 1 hour, 2 days, etc., or select the Any option from the list to provide a From and To date/time for report generation.
Note:
For every user registered with the eG Enterprise system, the administrator can indicate the maximum timeline for which that user can generate a report. Once the maximum timeline is set for a user, then, whenever that user logs into eG Reporter and attempts to generate a report, the Timeline list box in the report page will display options according to the maximum timeline setting of that user. For instance, if a user can generate a report for a maximum period of 3 days only, then 3 days will be the highest option displayed in the Timeline list - i.e., 3 days will be the last option in the fixed Timeline list. Similarly, if the user chooses the Any option from the Timeline list and proceeds to provide a start date and end date for report generation using the From and To specifications, eG Enterprise will first check if the user's Timeline specification conforms to his/her maximum timeline setting. If not, report generation will fail. For instance, for a user who is allowed to generate reports spanning over a maximum period of 3 days only, the difference between the From and To dates should never be over 3 days. If it is, then, upon clicking the Run Report button a message box will appear, prompting the user to change the From and To specification.
-
In large environments, reports generated using months of data can take a long time to complete. Administrators now have the option of generating reports on-line or in the background. When a report is scheduled for background generation, administrators can proceed with their other monitoring, diagnosis, and reporting tasks, while the eG manager is processing the report. This saves the administrator valuable time. To schedule background processing of a report, select the Background Save - PDF option from the Report Generation list. In this case, a Report Name text box will appear, where you would have to provide the name with which the report is to be saved in the background. To process reports in the foreground, select the Foreground Generation - HTML option from this list.
Note:
- The Report Generation list will appear only if the EnableBackgroundReport flag in the [BACKGROUND_PROCESS] section of the eg_report.ini file (in the {EG_INSTALL_DIR}\manager\config directory) is set to Yes.
- The default selection in the Report Generation list will change according to the Timeline specified for the report. If the Timeline set is greater than or equal to the number of days specified against the MinDurationForReport parameter in the [BACKGROUND_PROCESS] section of the eg_report.ini file, then the default selection in the Report Generation list will be Background Save - PDF. On the other hand, if the Timeline set for the report is lesser than the value of the MinDurationForReport parameter, then the default selection in the Report Generation list will be Foreground. This is because, the MinDurationForReport setting governs when reports are to be processed in the background. By default, this parameter is set to 2 weeks - this indicates that by default, reports with a timeline of 2 weeks and above will be processed in the background.
-
Finally, click on the Run Report button to generate the report. If the option chosen from the Report Generation list is Foreground Generation - HTML, then, clicking on the Run Report button will invoke Figure 2.
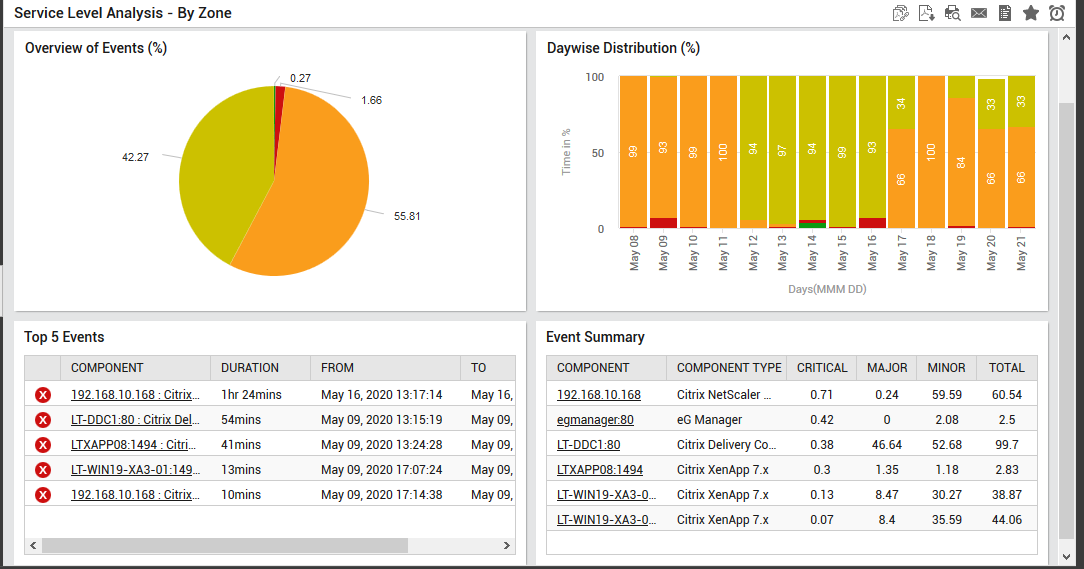
- There are four sections in the generated report (see Figure 2). The first section is a pie chart that provides a bird's-eye view of the health of the zone during the designated period. The slices of the pie chart and their respective colors represent the percentage of time the zone had been in different states (Normal, Critical, Major, Minor, and Unknown).
-
To drill down to the root-cause of the problems indicated by a slice in the pie chart, click on the slice. This will lead you to the Service Level Analysis - By Component report of exactly that component (associated with the chosen zone), the performance of which was badly hit by the problems indicated by the slice clicked on. For example, Figure 3 will appear when the ‘Critical’ slice in the pie chart of Figure 2 is clicked.
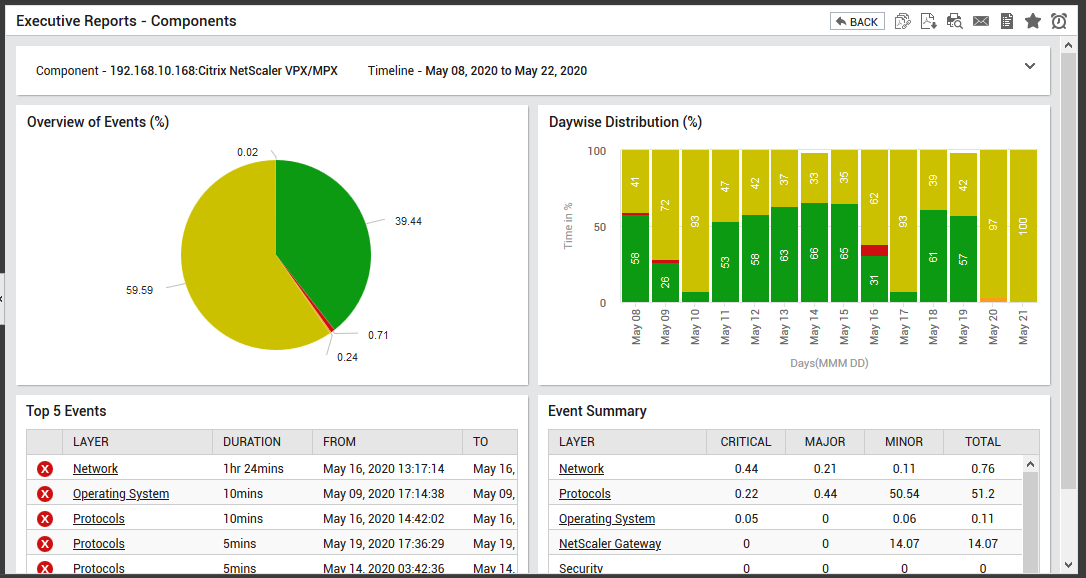
Figure 3 : Service Level Analysis Report of the Component causing problems in the zone performance
- From Figure 3, it is evident that the Citrix NetScaler VPX/MPX server is responsible for all the critical problems in the service during the given timeline.
-
The second section of this report is a bar graph that depicts how well the zone has performed on a daily basis during the specified period. The information depicted here will enable an executive to detect the daily trends in the performance of the zone. Here again, the various divisions within a bar and their respective colors denote the state variations in the service during the given period. The height of a division depends upon the duration (in minutes) for which the service has remained in a particular state.
Note:
By default, the DAYWISE DISTRIBUTION section of this page depicts the duration for which a zone has remained in a particular state, in minutes. Instead, if you prefer to view the percentage of time during a day a zone was in any particular state, set the Daywise distribution reports in flag in the MONITOR SETTINGS page (Configure -> Monitor Settings menu in the eG administrative interface) to Percentage.
-
When you click on a problem division in the bar, you will be able to view the Snapshot Report of the Component, which was the root-cause for the occurrence of that problem in the service on that particular day. For example, say, that you click on the Critical division in the bar that corresponds to 9th May 2020 of the chosen timeline. Doing so will open Figure 4, which clearly indicates that the Citrix NetScaler VPX/MPX was responsible for all the Critical problems in the zone on the 9th of May 2020.
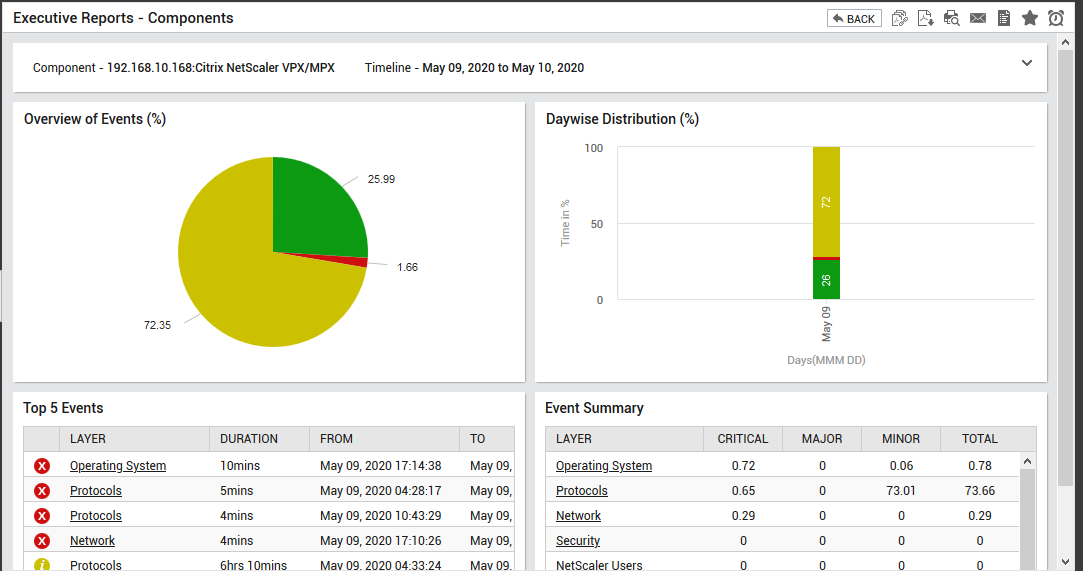
Figure 4 : Service Level Analysis report of the Component on a particular day
-
The third section is a summary table that highlights the top five alarms that have remained for the longest duration. The details displayed include the alarm priority, the service Component in which the problem was detected, the Duration of the problem, the date and time of problem occurrence (From) and the date and time of problem resolution (To). This information will help an executive figure out which components were responsible for some of the most severe problems in the zone.
Note:
The state of a zone is determined based on the states of its individual components. If any component of a zone is in a critical state, the zone is regarded as being in a critical state.
-
Click on the Component of your choice in this section to view the Service Level Analysis report of that Component for the specified period (see Figure 5).
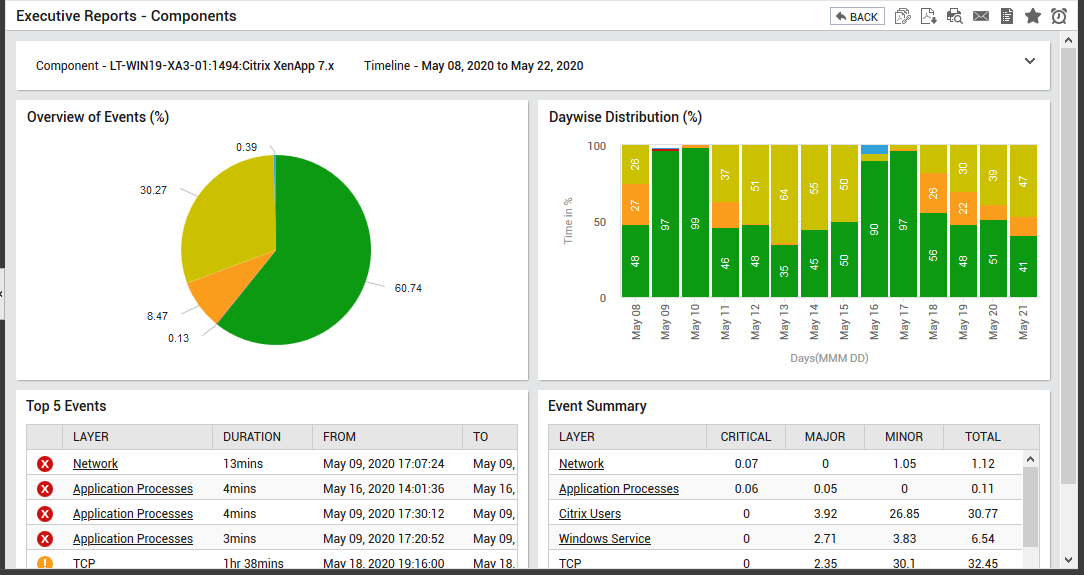
Figure 5 : Executive Summary Report of the Component that is clicked
-
The fourth section of the Service Level Analysis - By Zone report is another event summary, which not only lists all the components associated with the zone, but also indicates the percentage of time a component encountered Critical, Major, or Minor issues. This event summary, when viewed along with the top 5 summary, will help you accurately identify the problem-prone components of the service. Clicking on the Component name will reveal the Service Level Analysis report of that component for the chosen Timeline (see Figure 6).
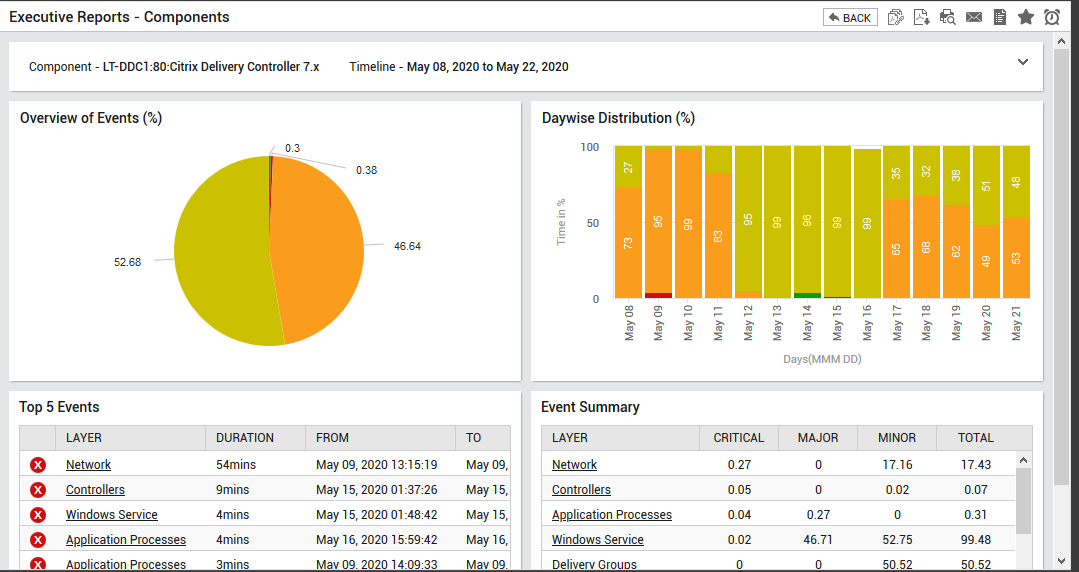
Figure 6 : Service Level Analysis report of the Component that was clicked on